To read this article --go here.
Subscribe to All American Investor via Email
 Wireless Reading Device
 Original content Bob DeMarco, All American Investor
Subscribe to All American Investor via Email
Wireless Reading Device Subscribe to The Alzheimer's Reading Room--via Email

Bob DeMarco is the editor of the Alzheimer's Reading Room and an Alzheimer's caregiver. The Alzheimer's Reading Room is the number one website on the Internet for news, advice, and insight into Alzheimer's disease. Bob has written more than 950 articles with more than 8,000 links on the Internet. Bob resides in Delray Beach, FL.

Subscribe to All American Investor via Email
Wireless Reading Device 
Subscribe to All American Investor via Email
Wireless Reading Device 
Subscribe to All American Investor via Email
Wireless Reading Device 
Subscribe to All American Investor via Email
Wireless Reading Device 
Subscribe to All American Investor via Email
Wireless Reading Device 
Subscribe to All American Investor via Email
Wireless Reading Device Subscribe to All American Investor via Email
Wireless Reading Device While RGE leans towards the U-shaped camp, we do not expect risky assets to invert their course as long as the Federal Reserve commits to maintaining “exceptionally low levels of the federal funds rate for an extended period.” So the policy dilemma is one of having to maintain “exceptionally low rates” given the still very difficult real economic conditions, but with the danger of an increasing disconnect between risky asset valuations and the economy–which could eventually snap back and compromise economic and financial stability in the medium term.
Subscribe to All American Investor via Email
 Wireless Reading Device
Subscribe to All American Investor via Email
Wireless Reading Device On June 26, 2008, the Federal Reserve Bank of New York (FRBNY) extended credit to Maiden Lane LLC under the authority of section 13(3) of the Federal Reserve Act. This limited liability company was formed to acquire certain assets of Bear Stearns and to manage those assets through time to maximize repayment of the credit extended and to minimize disruption to financial markets.

Subscribe to All American Investor via Email
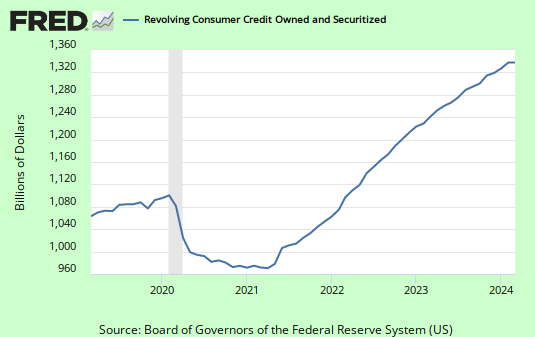
Wireless Reading Device Covers most short- and intermediate-term credit extended to individuals, excluding loans secured by real estate....
Subscribe to All American Investor via Email
Wireless Reading Device 5,594,000 versus 2,275,000 a year ago. In October, 35.6 percent of unemployed persons were jobless for 27 weeks or more.

Subscribe to All American Investor via Email
| Bob DeMarco is a citizen journalist and twenty year Wall Street veteran. Bob has written more than 950 articles with more than 8,000 links to his work on the Internet. Content from All American Investor has been syndicated on Reuters, the Wall Street Journal, Fox News, Pluck, Blog Critics, and a growing list of newspaper websites. Bob is actively seeking syndication and writing assignments. |
Wireless Reading Device In October, the unemployment rate rose to 10.2 percent, the highest rate since April 1983, and nonfarm payroll employment declined by 190,000.
Since the start of the recession, payroll employment has fallen by 7.3 million.

Subscribe to All American Investor via Email
Wireless Reading Device 
Subscribe to All American Investor via Email
Wireless Reading Device If you read Table 12 in the Bureau of Labor Statistics report you learned the real unemployment rate is 17.5 percent, not 10.2 percent.You would also have noticed the real rate of unemployment is 17.5 percent versus 11.1 percent in September 2008.
Subscribe to All American Investor via Email
In October, the unemployment rate rose to 10.2 percent, the highest rate since April 1983, and nonfarm payroll employment declined by 190,000.
Since the start of the recession, payroll employment has fallen by 7.3 million.
Subscribe to EF Hutton via Email
Wireless Reading Device 
