Thursday, April 30, 2009

Home Vacancies at a Record -- The Opportunity of a Lifetime


The time to buy the biggest house you can get your hands on is right now. Even if you own a house and it is underwater -- you should bite the bullet and sell it. Get a bigger home.

Sound nutty? I lived in Texas in the 1980s. I watched people scarp up houses in Houston for $400,000 -- houses that the previous owners paid $1.25 million to own.

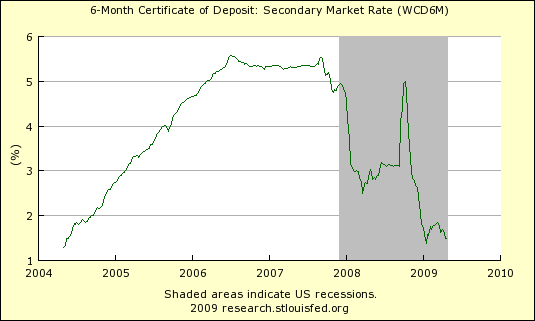
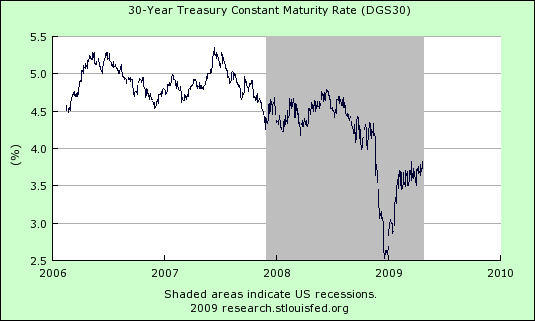
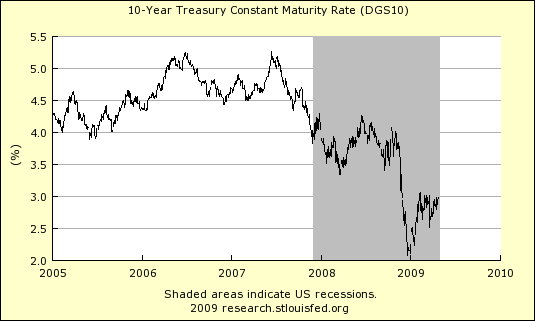
But today the opportunity is even better. In the late 80s mortgage interest rates were around 10 percent. Now? 4.5 percent.

Imagine 20 years from now, living in your nice big beautiful house, and you locked in your monthly payment way down here. On an inflation adjusted basis you will paying peanuts.

The time to borrow money is when interest rates are low. Most of you are probably too young to remember when mortgage interest rates were 15 percent. You probably are thinking it will never happen again.

What were you thinking and doing when the Internet stock bubble burst? What were you doing in 2006? Thinking about how you had to get a nice big fat, overpriced house?

Can't quite afford the down payment? Beg, borrow, steal -- do it.

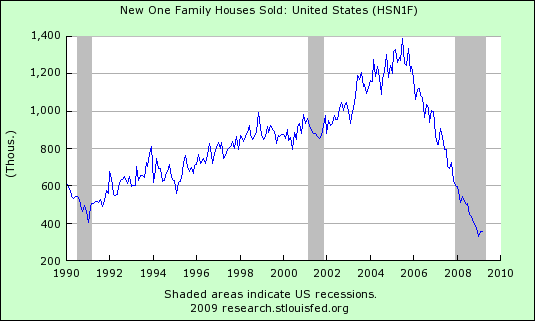
A record 19.1 million homes stood unoccupied in the first quarter and the U.S. homeownership rate fell as the recession sapped demand for real estate.

The number of vacant homes, including foreclosures, properties for sale and vacation properties, jumped from 18.6 million a year earlier, the U.S. Census Bureau said in a report today. Households that own their own residence declined for the third straight quarter to 67.3 percent.
Subscribe to All American Investor via Email


Bob DeMarco is a citizen journalist and twenty year Wall Street veteran. Bob has written more than 500 articles with more than 11,000 links to his work on the Internet. Content from All American Investor has been syndicated on Reuters, the Wall Street Journal, Fox News, Pluck, Blog Critics, and a growing list of newspaper websites. Bob is actively seeking syndication and writing assignments.


More from All American Investor


Follow All American Investor on Twitter

Fed Monetizing Debt -- How long before the Inflation Comes?


No matter how you cut or slice it, the FED is going to monetize debt. This means you want to be owning stocks and ETFs that benefit from an increase in inflation.

Over the next week, we will be putting up some of our ideas on how to take advantage of this scenario.

If you have been following the charts on All American Investor -- you noticed that I have been talking about rising rates in the ten and thirty year treasuries for a few weeks. If you are not paying close attention to this as in investor you are making a big mistake.

The bond vigilantes are coming back, and soon with a vengeance. Longer dated treasury interest rates are drifting up. This, in spite, of massive buying of treasuries by the FED -- we showed the balance sheet on Saturday.

Here is a snippet from the latest FOMC release:

As previously announced, to provide support to mortgage lending and housing markets and to improve overall conditions in private credit markets, the Federal Reserve will purchase a total of up to $1.25 trillion of agency mortgage-backed securities and up to $200 billion of agency debt by the end of the year. In addition, the Federal Reserve will buy up to $300 billion of Treasury securities by autumn. The Committee will continue to evaluate the timing and overall amounts of its purchases of securities in light of the evolving economic outlook and conditions in financial markets. The Federal Reserve is facilitating the extension of credit to households and businesses and supporting the functioning of financial markets through a range of liquidity programs. The Committee will continue to carefully monitor the size and composition of the Federal Reserve's balance sheet in light of financial and economic developments.

Buy $300 billion of treasuries by Autumn?

The best way to think of the current scenario is like boiling water in a tea pot. Sooner or later, the whistle will blow.

Don't like the above? Remember, I am the same guy that predicted this really in stocks when I wrote:
  • They call me crazy -- S and P 900-1000
  • and, Stocks Don't Fight the Tape.
There is a lot of chicken on the hill. My guess here right now is: material stocks, commodity stocks, related ETFs and short the long bond.
Subscribe to All American Investor via Email

Wednesday, April 29, 2009

GDP Still Trending Down (Graph)


This is a different look at GDP. 

The chart shows GDP as percent change from a year ago. The trend is clearly down. This chart shows a different picture than looking at quarterly change, and comparing GDP numbers quarter by quarter. 

The quarterly chart shows GDP improving from down 6.3 percent, to down 6.1 percent. A quick look at those numbers could easily lead one to believe that GDP is improving.  Is down 6.1 percent really better than down 6.3 percent?

Keep in mind, retail sales make up about two thirds of GDP.

GDP Pecent Change 429
Subscribe to All American Investor via Email


Follow All American Investor on Twitter

Gross Domestic Product Drops 6.1 Percent


Real gross domestic product -- the output of goods and services produced by labor and property located in the United States -- decreased at an annual rate of 6.1 percent in the first quarter of 2009, (that is, from the fourth quarter to the first quarter), according to advance estimates released by the Bureau of Economic Analysis. In the fourth quarter, real GDP decreased 6.3 percent.

The price index for gross domestic purchases, which measures prices paid by U.S. residents, decreased 1.0 percent in the first quarter, compared with a decrease of 3.9 percent in the fourth. Excluding food and energy prices, the price index for gross domestic purchases increased 1.4 percent in the first quarter, compared with an increase of 1.2 percent in the fourth. The federal pay raise for civilian and military personnel added 0.3 percentage point to the change in the first quarter gross domestic purchases price index.
Subscribe to All American Investor via Email
Bob DeMarco is a citizen journalist and twenty year Wall Street veteran. Bob has written more than 500 articles with more than 11,000 links to his work on the Internet. Content from All American Investor has been syndicated on Reuters, the Wall Street Journal, Fox News, Pluck, Blog Critics, and a growing list of newspaper websites. Bob is actively seeking syndication and writing assignments.

Real personal consumption expenditures increased 2.2 percent in the first quarter, in contrast to a decrease of 4.3 percent in the fourth. Durable goods increased 9.4 percent, in contrast to a decrease of 22.1 percent. Nondurable goods increased 1.3 percent, in contrast to a decrease of 9.4 percent. Services increased 1.5 percent, the same increase as in the fourth.

Real nonresidential fixed investment decreased 37.9 percent in the first quarter, compared with a decrease of 21.7 percent in the fourth. Nonresidential structures decreased 44.2 percent, compared with
a decrease of 9.4 percent. Equipment and software decreased 33.8 percent, compared with a decrease of 28.1 percent. Real residential fixed investment decreased 38.0 percent, compared with a decrease of 22.8 percent.

Real exports of goods and services decreased 30.0 percent in the first quarter, compared with a decrease of 23.6 percent in the fourth. Real imports of goods and services decreased 34.1 percent, compared with a decrease of 17.5 percent.

Real federal government consumption expenditures and gross investment decreased 4.0 percent in the first quarter, in contrast to an increase of 7.0 percent in the fourth. National defense decreased 6.4 percent, in contrast to an increase of 3.4 percent. Nondefense increased 1.3 percent, compared with an increase of 15.3 percent. Real state and local government consumption expenditures and gross
investment decreased 3.9 percent, compared with a decrease of 2.0 percent.

The real change in private inventories subtracted 2.79 percentage points from the first-quarter
change in real GDP after subtracting 0.11 percentage point from the fourth-quarter change. Private businesses decreased inventories $103.7 billion in the first quarter, following decreases of $25.8 billion in the fourth quarter and $29.6 billion in the third.

Real final sales of domestic product -- GDP less change in private inventories -- decreased 3.4 percent in the first quarter, compared with a decrease of 6.2 percent in the fourth.


Gross domestic purchases

Real gross domestic purchases -- purchases by U.S. residents of goods and services wherever produced -- decreased 7.8 percent in the first quarter, compared with a decrease of 5.9 percent in the fourth.


Disposition of personal income

Current-dollar personal income decreased $59.9 billion (2.0 percent) in the first quarter, compared with a decrease of $42.9 billion (1.4 percent) in the fourth.

Personal current taxes decreased $193.5 billion in the first quarter, in contrast to an increase of $19.7 billion in the fourth.

Disposable personal income increased $133.6 billion (5.1 percent) in the first quarter, in contrast to a decrease of $62.6 billion (2.3 percent) in the fourth. Real disposable personal income increased 6.2 percent, compared with an increase of 2.7 percent.

Personal outlays increased $18.1 billion (0.7 percent) in the first quarter, in contrast to a decrease of $260.2 billion (9.5 percent) in the fourth. Personal saving -- disposable personal income less personal outlays -- was $453.0 billion in the first quarter, compared with $337.4 billion in the fourth. The personal saving rate -- saving as a percentage of disposable personal income -- was 4.2 percent in the first quarter, compared with 3.2 percent in the fourth. For a comparison of personal saving in BEA’s national income and product accounts with personal saving in the Federal Reserve Board’s flow of funds accounts and data on changes in net worth, go to http://www.bea.gov/bea/dn/nipaweb/Nipa-Frb.asp.


Current-dollar GDP

Current-dollar GDP -- the market value of the nation's output of goods and services -- decreased 3.5 percent, or $124.8 billion, in the first quarter to a level of $14,075.5 billion. In the fourth quarter, current-dollar GDP decreased 5.8 percent, or $212.5 billion.


Follow All American Investor on Twitter

Tuesday, April 28, 2009

Obama Administration Announces New Details on Making Home Affordable Program


This is really a public service announcement. I hope it helps you, or maybe you can pass it long to someone who needs the information.

If you know anyone that actually received a new mortgage under the Making Home Affordable Program let us know.

My guess based on what I have hear, and from talking to mortgage bankers, is that this plan is going no where fast. I hope I am wrong.

Some the key points:
  • The Second Lien Program announced today will work in tandem with first lien modifications offered under the Home Affordable Modification Program to deliver a comprehensive affordability solution for struggling borrowers. Second mortgages can create significant challenges in helping borrowers avoid foreclosure, even when a first lien is modified. Up to 50 percent of at-risk mortgages have second liens, and many properties in foreclosure have more than one lien. Under the Second Lien Program, when a Home Affordable Modification is initiated on a first lien, servicers participating in the Second Lien Program will automatically reduce payments on the associated second lien according to a pre-set protocol. Alternatively, servicers will have the option to extinguish the second lien in return for a lump sum payment under a pre-set formula determined by Treasury, allowing servicers to target principal extinguishment to the borrowers where extinguishment is most appropriate.
Subscribe to All American Investor via Email
  • Hope for Homeowners requires the holder of the mortgage to accept a payoff below the current market value of the home, allowing the borrower to refinance into a new FHA-guaranteed loan. Refinancing into a new loan below the home's market value takes a borrower from a position of being underwater to having equity in their home. By increasing a homeowner's equity in the home, Hope for Homeowners can produce a better outcome for borrowers who qualify.
  • Under the changes announced today and, when evaluating borrowers for a Home Affordable Modification, servicers will be required to determine eligibility for a Hope for Homeowners refinancing. Where Hope for Homeowners proves to be viable, the servicer must offer this option to the borrower. Note mine: I really have no idea what this means, if you do, hit the comments box.
  • Continuing to bolster its outreach around the program, the Administration also announced today a new effort to engage directly with homeowners via MakingHomeAffordable.gov. Starting today, homeowners will have the ability to submit individual questions through the website to the Administration's housing team. Members of the Treasury and HUD staffs will periodically select commonly asked questions and post responses on MakingHomeAffordable.gov. To submit a question, homeowners can visit www.MakingHomeAffordable.gov/feedback.html. Selected questions from homeowners across the country and responses from the Administration will be available at www.MakingHomeAffordable.gov/asked-and-answered.html.


More detailed Information:


Bob DeMarco is a citizen journalist and twenty year Wall Street veteran. Bob has written more than 500 articles with more than 11,000 links to his work on the Internet. Content from All American Investor has been syndicated on Reuters, the Wall Street Journal, Fox News, Pluck, Blog Critics, and a growing list of newspaper websites. Bob is actively seeking syndication and writing assignments.


Follow All American Investor on Twitter

How Banks Gough Consumers and Make Money (Chart)


You have probably been reading about how banks are raising credit card interest rates -- even on their best customers.

On the other hand, if you want to buy a certificate of deposit (CD) you might be shocked to learn that banks are lowering interest rates on six month certificates of deposit.

Nationally 6 month CD rates have fallen to 1.48 percent, down from 1.69 percent -- 3 weeks ago. A year ago six months CDs were running at 3.03 percent.

Bank interest rate margin spreads are widening all over the place. This is how banks make boat loads of money. They leverage up the interest rate curve to take advantage of the artificially low interest rates being create by the FED (a standard procedure by the FED in a recession). And, they gough (?) consumers coming and going.

6 month CD 427
Subscribe to All American Investor via Email
Bob DeMarco is a citizen journalist and twenty year Wall Street veteran. Bob has written more than 500 articles with more than 11,000 links to his work on the Internet. Content from All American Investor has been syndicated on Reuters, the Wall Street Journal, Fox News, Pluck, Blog Critics, and a growing list of newspaper websites. Bob is actively seeking syndication and writing assignments.

Dendreon (DNDN) Hot Chart


Dendreon Corporation (DNDN). Did you own this stock? Well somebody did and it wasn't me. The stock has risen from the 4.25 area to the 22.50 area in the last 20 days.

Note: news due today at 2 PM eastern.

DNDN Chart

Dendreon Corporation (DNDN), a biotechnology company, engages in the discovery, development, and commercialization of therapeutics to enhance cancer treatment options for patients.

Dendreon applies its expertise in antigen identification, engineering and cell processing to produce Active Cellular Immunotherapy (ACI) product candidates designed to stimulate an immune response. ACI holds promise because it may provide patients with a meaningful clinical benefit, such as survival, combined with low toxicity. In addition to ACI product candidates, the company is researching small molecule product candidates.

Dendreon Newsroom

Dendreon Presents Preclinical Data Demonstrating Activity of TRPM8 agonist, D-3263, in Benign Prostatic Hyperplasia
Subscribe to All American Investor via Email


Bob DeMarco is a citizen journalist and twenty year Wall Street veteran. Bob has written more than 500 articles with more than 11,000 links to his work on the Internet. Content from All American Investor has been syndicated on Reuters, the Wall Street Journal, Fox News, Pluck, Blog Critics, and a growing list of newspaper websites. Bob is actively seeking syndication and writing assignments.


More from All American Investor


Follow All American Investor on Twitter

Monday, April 27, 2009

Treasury Borrowing increased By $196 Billion (April - June)


Treasury Announces Marketable Borrowing Estimates

The U.S. Department of the Treasury today announced its current estimates of marketable borrowing for the April - June 2009 and July – September 2009 quarters:

During the April – June 2009 quarter. 
  • Treasury expects to borrow $361 billion of marketable debt, 
  • assuming an end-of-June cash balance of $245 billion, 
  • which includes $200 billion for the Supplementary Financing Program (SFP). 
  • The borrowing estimate is $196 billion higher than announced in February 2009. The increase in borrowing is primarily related to a continuation of the SFP, and lower receipts and outlays.
During the July – September quarter. 
  • Treasury expects to borrow $515 billion of marketable debt,
  • assuming an end-of-September cash balance of $270 billion,
  • which includes $200 billion for the SFP.
Also see: Statement for the Treasury Borrowing Advisory Committee

Source: U.S. Department of the Treasury.
Subscribe to All American Investor via Email

Insiders Selling into Rally


Is this a good or a bad thing? I know one thing it is never a good sign when insiders start selling. Insider selling is often a barometer of confidence.

Lack of confidence in their own company by insiders is often followed by negative reporting down the road.

Is it panic? Or, is the outlooks so dismal that insiders want to get out why the gettin is good.

If you own a stock, and the insiders are selling, it is usually a red flag.
Executives and insiders at U.S. companies are taking advantage of the steepest stock market gains since 1938 to unload shares at the fastest pace since the start of the bear market.
While the Standard & Poor’s 500 Index climbed 28 percent from a 12-year low on March 9, CEOs, directors and senior officers at U.S. companies sold $353 million of equities this month, or 8.3 times more than they bought, data compiled by Washington Service, a Bethesda, Maryland-based research firm, show. That’s a warning sign because insiders usually have more information about their companies’ prospects than anyone else, according to William Stone at PNC Financial Services Group Inc.
Do insiders know something you don't know?

Insider Selling Jumps to Highest Level Since 2007
Subscribe to All American Investor via Email


Follow All American Investor on Twitter

Why Dividends are Important—Part III


By Steve Cook.
Steve Cook has 36 years experience in trading and analyzing both fixed income and equity securities, as well as in private placements of debt and equity. CJS Research is currently offering a 30 day free trial of their Dividend Strategy Product.
Why Dividends are Important—Part III

Quick, what’s a stock worth?

Answer: the discounted value of future cash flow. Not book value, not a new technology, not a hundred and one of other factors that you can name.

Sure all those factors may bear on a stock’s dividend or the price for which a stock is ultimately sold. But the only way we as investors get paid a return for the money we invest in a stock is to either have that money returned to us as dividends, or to sell that stock at a price higher than we bought it. Everything thing else is just a bunch of numbers on a piece a paper. You can’t eat them or spend them.

Now think about the decision making process that the companies in whose stock you are investing go through when they make an investment decision. The rate of return on a project is equal to the discounted value of future cash flow--what the project will be ‘worth’ in ten years is irrelevant.

For the company
  • it is when do we get our cash back,
  • how much do we get back
  • and what is the probability of both?
In these calculations, the quicker the return and the higher the probability of the return, the more the cash flow is worth.

So why should you or I analyze our investments any differently? Why should the future market value of a project (price of a stock) matter more to us than it does to the guys who are running it? And why should the future value of a project (price of a stock) matter more than the current return on that project?

A simple way of thinking about this is as follows: Suppose that you just bought Coca Cola today and I offer you three opportunities to increase your investment return on Coke, pick one.
  1.  if Coke pays a dividend on its next scheduled payment date, I will give you a $500 bonus,
  2.  if Coke pays a dividend equal to or greater than its last dividend payment, I will give you a $1,000 bonus 
  3.  if the price of Coke’s stock on its next ex dividend date is higher than it is today. I will give you $1,500.
Which one would you take? If you didn’t chose (2) stop reading, take the dividend you earned from Coke and go buy a Playboy.

The point is that of the two sources of potential return on your investment, (1) dividends a lot more likely to occur on a short term basis than capital gains (2) they are an immediate return on money that you can either re-invest or spend--its Your Money and your choice and (3) a rising stream of cash flow is worth a lot more to you [and corporate management] today than what the project [stock] generating that cash flow might be worth five years from now.


News on Stocks in Our Portfolios

3M (Dividend Growth Portfolio) reported first quarter earnings per share of $.81 versus expectations of $.86 and $1.38 reported in its comparable 2008 quarter.
Subscribe to All American Investor via Email


Interest Rates at minus 5 Percent? (Charts)


There is an interesting article on the Financial Times pages that alludes to an internal FED analysis that the optimum interest rate right now would be -5%.
The ideal interest rate for the US economy in current conditions would be minus 5 per cent, according to internal analysis prepared for the Federal Reserve’s last policy meeting.

The analysis was based on a so-called Taylor-rule approach that estimates an appropriate interest rate based on unemployment and inflation.
Later in the article there is a short discussion of the FEDs massive expansion of bank reserves that is designed to keep rates near zero (see Reserve Bank Credit Soaring Again (Graph))

The FED has once again started buying Treasuries to keep rates down. Is it working? Just this weekend I published two charts that showed that ten year government and thirty year government bond interest rates are creeping up. See: 10 Year Treasury Closes above 3 Percent (Graph) and 30 Year Goverment Bond Signaling Problems Ahead (Chart).

All of this is worrisome and it should have holders of stocks paying attention.

Fed study puts ideal US interest rate at -5%
Subscribe to All American Investor via Email

Bob DeMarco is a citizen journalist and twenty year Wall Street veteran. Bob has written more than 500 articles with more than 11,000 links to his work on the Internet. Content from All American Investor has been syndicated on Reuters, the Wall Street Journal, Fox News, Pluck, Blog Critics, and a growing list of newspaper websites. Bob is actively seeking syndication and writing assignments.


More from All American Investor


Follow All American Investor on Twitter

Sunday, April 26, 2009

60 minutes Clean Coal Dilemma Over Coal Generated Power (Video and Text)


The Dilemma Over Coal Generated Power


The future of our climate might be summed up in one question: what do we do about coal? Coal generates nearly half the electricity in the United States and the world. But it's the dirtiest fuel of all when it comes to carbon dioxide, or CO2, the leading greenhouse gas.

A few days ago, the Obama administration declared, for the first time, that CO2 is a threat to human health and it plans to impose limits. But making coal safe will come at an astronomical cost.

After the economy, this could be the biggest debate in Washington. One of the most influential people in this is Jim Rogers. Coal has made Rogers and his company rich and that's why we were surprised to hear what this high flying power baron has to say about what coal does to the environment.
Subscribe to All American Investor via Email

Rogers wanted 60 Minutes to see America's enormous dependency on coal, so he flew correspondent Scott Pelley out to see one of his 20 coal burning power plants.

"I remember the first time I took a helicopter and looked down on a power plant like this. I was 41 years old and I said, 'Oh my goodness, I'm responsible for that!'" Rogers told Pelley.

Rogers is the CEO of Duke Energy, the nation's third largest electric utility. His stacks pump 100 million tons of carbon dioxide every year, which makes what comes out of Rogers' mouth so surprising.

"Controlling carbon emissions in the near future is inevitable in your view. This is going to happen," Pelley remarked.

"It’s inevitable in my judgment," Rogers agreed.

"You're one of the biggest polluters in the world when it comes to carbon emissions," Pelley pointed out.

"We're one of the largest emitters. And it tells you how daunting the challenge is that we have in front of us," Rogers replied.

"You know, there are a lot of people many of them in your industry may who you probably know who say that global warming is not a big problem," Pelley said.

"It's my judgment it is a problem," Rogers said. "We need to go to work on it now. And it's critical that we start to act in this country."

Like a reformed tobacco executive, Rogers says we can't survive the emissions his industry creates. He showed 60 Minutes what he means at a North Carolina power station that can light up one and a half million homes.

Rogers told Pelley that particular plant burns roughly 19,000 tons of coal. "That's two train loads. And each train has about 100 cars," he explained.

The fact is, America runs on coal and here's one of the reasons why: the Powder River Basin that stretches across Wyoming and Montana may be the largest coal reserve on Earth. We've got 200 years worth of reserves - cheap, and right under our feet. No wonder coal generates half of our electricity.

But here's the brutal part: coal is twice as dirty as natural gas and puts more carbon dioxide in the air than all of our cars and trucks. In short, we're caught between a rock and a hot place.

"I notice all of this coming out of the stacks. What is that?" Pelley asked.

"That's good news," Rogers said. "When you see a plume comin' out of a stack of a power plant, that's vapor. And it basically says that the emissions have been cleaned."

The power industry spent billions in the 1990's cleaning up much of the sulfur and nitrogen oxides that cause acid rain. But those pollutants are mere drops in a stream of carbon dioxide. Rogers says getting rid of the carbon will require a new federal law to limit emissions and a new technology to clean up coal. At the same time, he says, Duke will transition to more wind, solar and nuclear power.

"Our goal line is substantially to reduce our carbon footprint, to de-carbonize our business, by 2050," he explained.

"Four decades? That's a long time," Pelley remarked.

"Well, it took a hundred years to get to where we are. And we can’t do this overnight," Rogers said.

But Jim Hansen, NASA's top climate scientists, says 2050 is too late. "We will have guaranteed disasters for our children, grandchildren, and the unborn," he said.

Hansen is credited with some of the earliest and most accurate projections of climate change. He thinks Roger's plan leaves the Earth in the oven decades too long.

"We are going to have to phase out emissions from coal within the next 20 years if we hope to prevent climate disasters," Hansen told Pelley.

"Are you saying we can't build any new coal fired power plants in this country?" Pelley asked.

"Absolutely, not only in this country, but in the world. This is not yet understood. We are going to have to have a moratorium on new coal-fired power plants within the next few years and phase out the existing ones over the next 20 years or so if we have to preserve the climate like the one that has existed the last several thousand years," Hansen said.

You know, Jim Rogers will hasten to tell you he does share your sense of urgency," Pelley remarked.

"Well, his plan doesn't match that," Hansen replied.

In fact, right now Rogers is building two new coal plants. "You're talking a great game, but you're building coal-fired power plants," Pelley pointed out.

"I am following through on what is job one for me, making sure my customers have affordable, reliable, clean electricity," Rogers said.

Asked what would happen if we abandoned coal at this point, Rogers said, "We can't abandon coal. We have to find a way to keep it and use it in the future. And that means the ability to clean it up."

Rogers' plan of cleaning it up over 40 years involves something the coal and power industries promote as "clean coal technology." In fact they say we can't live without it.

"And we have to advance new clean coal technologies. If we don't, we may have to say goodbye to the American way of life that we all know and love," an ad for clean coal warned.

It is a seductive idea: cleaning up the carbon would solve everything. And during the presidential campaign both candidates endorsed clean coal.

"This is America - we figured out how to put a man on the moon in 10 years. You tell me we can't find a way to burn coal that we mine right here in the United States of America and make it work," then-candidate Barack Obama said.

Well, they did find a way to make it work. The problem is, clean coal makes putting a man on the moon look easy. The technology is called carbon capture and sequestration. We found the only place you can see it in America - the Basin Electric Power Co-Operative in North Dakota. Basin captures half its CO2, but they didn't build this because of climate change.

Long before anyone heard of global warming, Basin was conceived in the Carter administration to prove that America could use its own fuel - coal - and turn it into natural gas. They had to take the carbon out because it was an impurity.

"Before you started pumping it into the ground, and into the pipeline, where did it come out?" Pelley asked.

"That stack right up there," Floyd Robb of the power cooperative explained.

Carbon capture takes the carbon dioxide, turns it into a liquid and pumps it underground. Virtually everyone agrees, industry, environmentalists and politicians, that this is the only way we know to make coal safe for the planet. But consider taxpayers built this for one and a half billion dollars in the 1980’s. That would be $4 billion today.

Dan Kammen says carbon capture would be an enormous national engineering project. He's a Berkeley physicist and top expert on energy.

"Can enough carbon capture and sequestration facilities like this one be built in time to prevent climate change from coal?" Pelley asked.

"I don't think anyone knows the answer to that precisely. We know we have to try. And we know these facilities do work. Whether we can build enough of them to preserve the coal industry as we know it today I think is a question," Kammen said.

Kammen told Pelley that there are hundreds of coal-fired plants in the United States, and that each one would need to be outfitted with carbon caption sequestration plants.

"What are we talking about here in terms of infrastructure?" Pelley asked.

"So, we're talking about hundreds of billions, to a trillion dollars or so, and every power plant needs to capture its greenhouse gases," Kammen estimated.

Joe Romm thinks a trillion dollars might be optimistic. Romm ran alternative fuel projects in the Clinton administration.

He says the amount of CO2 we're talking about is mind-boggling. "If the world did this at scale, it would be the equivalent amount of CO2 going into the ground as oil now comes out of the ground. So you have to recreate the entire oil delivery infrastructure of the planet, which was built up over a century, just to deal with this CO2," he explained.

Asked if it is practical, Romm told Pelley, "That we don't know yet. No one has ever taken large volumes of CO2 and stuck it in these deep, underground aquifers and then measured and verified that it stays there permanently. I mean, after all if it doesn't stay there permanently, if it leaks out slowly, it's not saving the climate. Remember we've spent 30 years just trying to get one repository for nuclear waste, Yucca Mountain, and we haven't succeeded. Now we're going to need dozens and dozens of repositories for CO2.

"It is not impossible," Duke Energy CEO Jim Rogers argued. "What we need in this country is what I would call a Marshall Plan. We rebuilt the economies of Japan and Germany after World War II. We need to rebuild our economy and transition it to a low carbon economy. We can do that. But it's gonna take trillions of dollars to do it."

Trouble is, there is a Marshall plan today, and it's rebuilding Wall Street. Add to that Congress projection of record federal deficits of a trillion dollars. And it turns out not even the industry that warns of the end of our way of life is paying for it.

Asked how much Duke Energy has invested in carbon sequestration technology so far," Rogers said, "We have not invested any dollars in the technology, per say. We have spent a lot of time and money reviewing and analyzing the various technologies."

"But come on, you admit to being the third largest carbon producer in the United States. You tell me that carbon sequestration is the future, because we can't afford to live without coal. But then you tell me you haven't invested any money in carbon sequestration," Pelley remarked.

"While we haven't spent the money on sequestration technology we spent the time and the energy and we're going to co-invest with the government when this technology evolves," Rogers explained.

If capturing carbon in the U.S. is decades away, consider that China and India now put more carbon in the air than we do and the Chinese are opening coal-fired plants at a rate of one a week. None captures its carbon. Rogers has broken ground on his two new coal-fired plants despite warnings from scientists, like NASA’s Jim Hansen.

"So when Jim Hansen says that to save the planet, we should stop building coal-fired power plants today you say what?" Pelley asked Rogers.

"I say, 'Mr. Hansen, can't get done, won't get done,'" Rogers replied. "We've got to keep our economy going. We've got to make the transition. And I'm gonna do everything I can with the greatest sense of urgency to make the transition. But to do what you ask me to do now is just not doable."


President Obama wants to speed up cleaner technologies by taxing utilities for the carbon they produce. But the idea is meeting some stiff resistance in Congress.

Bob DeMarco is a citizen journalist and twenty year Wall Street veteran. Bob has written more than 500 articles with more than 11,000 links to his work on the Internet. Content from All American Investor has been syndicated on Reuters, the Wall Street Journal, Fox News, Pluck, Blog Critics, and a growing list of newspaper websites. Bob is actively seeking syndication and writing assignments.


Follow All American Investor on Twitter

30 Year Goverment Bond Signaling Problems Ahead (Chart)


Thirty Year Government Bond, Daily Price.


The 30 year Treasury Bond yield is drifting slowly upwards. This indicates there is little interest in the bond. With a slew of government debt on the horizon this does not bode well.

The thirty year remains a good proxy of future inflation expectations and should be watched closely. This is exactly what we intend to do.


30 Year Treasury 424
Subscribe to All American Investor via Email


Bob DeMarco is a citizen journalist and twenty year Wall Street veteran. Bob has written more than 500 articles with more than 11,000 links to his work on the Internet. Content from All American Investor has been syndicated on Reuters, the Wall Street Journal, Fox News, Pluck, Blog Critics, and a growing list of newspaper websites. Bob is actively seeking syndication and writing assignments.


More from All American Investor


Follow All American Investor on Twitter

Conoco Phillips (COP) great yield, great chart


Conoco Phillips (Cop) yields 4.60 percent. The chart looks good and a close over 42.50 would confirm the change in trend. The stock traded near 57.50 on January 9. I started thinking about this stocks after hearing Jim Cramer tout it on Mad Money.

Conoco Phillips 426


Subscribe to All American Investor via Email


Bob DeMarco is a citizen journalist and twenty year Wall Street veteran. Bob has written more than 500 articles with more than 11,000 links to his work on the Internet. Content from All American Investor has been syndicated on Reuters, the Wall Street Journal, Fox News, Pluck, Blog Critics, and a growing list of newspaper websites. Bob is actively seeking syndication and writing assignments.


More from All American Investor


Follow All American Investor on Twitter

Saturday, April 25, 2009

10 Year Treasury Closes above 3 Percent (Graph)


Ten Year Treasury Daily Yield Chart

10 Year Treasury Interest Rate Chart 424

The ten year Treasury closed at 3.03 on Friday. It looks to me like interest rates are turning up in spite of the FEDs buying of treasuries and mortgage backed securities. This does not bode well for longer dated Treasury securities in the months ahead. Treasury supply is going to rise dramatically and right now there is little demand for the ten year as evidenced by the shape of the yield curve.

I expect the ten year to test the critical 3.125 area soon. If this area is broken the long term downtrend in ten year interest rates will have come to an end.
Subscribe to All American Investor via Email


Bob DeMarco is a citizen journalist and twenty year Wall Street veteran. Bob has written more than 500 articles with more than 11,000 links to his work on the Internet. Content from All American Investor has been syndicated on Reuters, the Wall Street Journal, Fox News, Pluck, Blog Critics, and a growing list of newspaper websites. Bob is actively seeking syndication and writing assignments.


More from All American Investor


Follow All American Investor on Twitter

Reserve Bank Credit Soaring Again (Graph)


Reserve Bank Credit, Factors Affecting Reserve Balances

The Federal Reserve is starting to expand their balance sheet again. Week over Week.
  • The biggest increase this week is in the purchase of Mortgage Backed Securities (MBS) -- up $75 Billion. 
  • An additional $18 Billion increase in Maiden Lane LLC (Bear Stearns bailout).
  • An additional $ 34 Billion increase in Maiden Lane II LLC and Maiden Lane III LLC (AIG bailout).
  • U.S. Treasury securities held outright rose $94 Billion, and $405 Billion versus a year ago.
  • Reserve Bank Credit rose $70 Billion week, and $1.3 Trillion versus a year ago.
  • Reserve Bank Credit now stands at $2.169 Trillion and is once again approaching the peak of $2.31 Trillion (December, 2008).

Reserve Bank Credit 424

Notes: H.4.1 Reserve Bank credit is the sum of securities held outright, repurchase agreements, term auction credit, other loans, net portfolio holdings of Commercial Paper Funding Facility LLC, net portfolio holdings of LLCs funded through the Money Market Investor Funding Facility, net portfolio holdings of Maiden Lane LLC, net portfolio holdings of Maiden Lane II LLC, net portfolio holdings of Maiden Lane III LLC, float, central bank liquidity swaps, and other Federal Reserve assets
Subscribe to All American Investor via Email
Bob DeMarco is a citizen journalist and twenty year Wall Street veteran. Bob has written more than 500 articles with more than 11,000 links to his work on the Internet. Content from All American Investor has been syndicated on Reuters, the Wall Street Journal, Fox News, Pluck, Blog Critics, and a growing list of newspaper websites. Bob is actively seeking syndication and writing assignments.


Follow All American Investor on Twitter

St Louis Monetary Base Soars to Record High (Graph)


St. Louis Weekly Reserves and Monetary Base

The biggest spike in the base started in October, 2008 in response to the growing financial crisis. From that perspective, we are only six months into this monster attempt at reinflation. A general rule of thumb says it takes 6 to 18 months to see the reaction from monetary inflation. We are entering the window now.

It is interesting that we are seeing all these deflationary numbers now. It reminded me of how inflation soared to over 1.5 percent a month in 1980.  At that time,  it appeared that the world was coming to an end. Paul Volcker stepped in and tightened, causing interest rates and inflation to came down fast. It also lead to the great bull market in stocks that started in 1982. 

It is going to be interesting to see how high interest rates go when the Fed is forced to reverse field. A risky strategy for certain.

Source Base 425

Note: Sum of currency in circulation, reserve balances with Federal Reserve Banks, and service-related adjustments to compensate for float. Calculated by the Federal Reserve Bank of St. Louis.
Subscribe to All American Investor via Email
Bob DeMarco is a citizen journalist and twenty year Wall Street veteran. Bob has written more than 500 articles with more than 11,000 links to his work on the Internet. Content from All American Investor has been syndicated on Reuters, the Wall Street Journal, Fox News, Pluck, Blog Critics, and a growing list of newspaper websites. Bob is actively seeking syndication and writing assignments.


Follow All American Investor on Twitter

M2 Money Stock (Updated Graph)


M2 Money Stock

M2 rose to a new all time high $8,418.5 billion.

Meanwhile, the ten year Treasury moved up to close over 3 percent at 3.03. All interest rates across the curve rose.

M2 Chart 425

Note: H.6 Money Stock Measures, M2 includes a broader set of financial assets held principally by households. M2 consists of M1 plus: (1) savings deposits (which include money market deposit accounts, or MMDAs); (2) small-denomination time deposits (time deposits in amounts of less than $100,000); and (3) balances in retail money market mutual funds (MMMFs).

Subscribe to All American Investor via Email

Bob DeMarco is a citizen journalist and twenty year Wall Street veteran. Bob has written more than 500 articles with more than 11,000 links to his work on the Internet. Content from All American Investor has been syndicated on Reuters, the Wall Street Journal, Fox News, Pluck, Blog Critics, and a growing list of newspaper websites. Bob is actively seeking syndication and writing assignments.


More from All American Investor


Follow All American Investor on Twitter

Friday, April 24, 2009

New Houses Sold --Still a Drag on the Economy (Graph)


New One Family Houses Sold: United States, Monthly, Thousands

Houses Sold

Latest reading 356,000 versus 358,000 the previous month. The high 1,305,000 (October, 2004), the low 331,00 (January, 2009).

We should be coming into the seasonally strong period and this should give us a better idea about the prospects for new home sales. The average for April, May, June 2008 was around 860,000 units.
Subscribe to All American Investor via Email


Bob DeMarco is a citizen journalist and twenty year Wall Street veteran. Bob has written more than 500 articles with more than 11,000 links to his work on the Internet. Content from All American Investor has been syndicated on Reuters, the Wall Street Journal, Fox News, Pluck, Blog Critics, and a growing list of newspaper websites. Bob is actively seeking syndication and writing assignments.

Durable Goods Hanging by a Thread (Graph)


Manufacturers' New Orders: Durable Goods, Monthly, Millions of Dollars, Seasonally Adjusted

Durable Goods 424

The current reading is 161,192 versus 162,482 (in millions). The low reading so far was 159,187 versus the high 219,286. That equals 60,099 millions.

I shudder to think what is going to happen if this series makes new lows. Bad news? If you look at the chart we are hanging by a thread. Good news? The worst might be behind us.
Subscribe to All American Investor via Email

Roubini: Economist Forecast on Economy Optimistic


Mild signs that the rate of economic contraction is slowing in the United States, China and other parts of the world have led many economists to forecast that positive growth will return to the US in the second half of the year, and that a similar recovery will occur in other advanced economies.

The emerging consensus among economists is that growth next year will be close to the trend rate of 2.5 per cent.
This consensus optimism is, I believe, not supported by the facts. Indeed, I expect that while the rate of US contraction will slow from -6 per cent in the last two quarters, US growth will still be negative (around -1.5 to -2 per cent) in the second half of the year (compared to the bullish consensus of +2 per cent).


Subscribe to All American Investor via Email

End of Economic Gloom? Not as Early as You Wish. Roubini’s latest Article for Project Syndicate

End of economic gloom? Nouriel Roubini

Mild signs that the rate of economic contraction is slowing in the United States, China and other parts of the world have led many economists to forecast that positive growth will return to the US in the second half of the year, and that a similar recovery will occur in other advanced economies.

The emerging consensus among economists is that growth next year will be close to the trend rate of 2.5 per cent.

Investors are talking of 'green shoots' of recovery and of positive 'second derivatives of economic activity' (continuing economic contraction is the first, negative, derivative, but the slower rate suggests that the bottom is near).

As a result, stock markets have started to rally in the US and around the world. Markets seem to believe that there is light at the end of the tunnel for the economy and for the battered profits of corporations and financial firms.

This consensus optimism is, I believe, not supported by the facts. Indeed, I expect that while the rate of US contraction will slow from -6 per cent in the last two quarters, US growth will still be negative (around -1.5 to -2 per cent) in the second half of the year (compared to the bullish consensus of +2 per cent).

Moreover, growth next year will be so weak (0.5 to 1 per cent, as opposed to the consensus of 2 per cent or more) and unemployment so high (above 10 per cent) that it will still feel like a recession.

In the euro zone and Japan, the outlook for 2009 and 2010 is even worse, with growth close to zero even next year. China will have a more rapid recovery later this year, but growth will reach only 5 per cent this year and 7 per cent in 2010, well below the average of 10 per cent over the last decade.

Given this weak outlook for the major economies, losses by banks and other financial institutions will continue to grow. My latest estimates are $3.6 trillion in losses for loans and securities issued by US institutions, and $1 trillion for the rest of the world.

It is said that the International Monetary Fund, which earlier this year revised upward its estimate of bank losses, from $1 trillion to $2.2 trillion, will announce a new estimate of $3.1 trillion for US assets and $0.9 trillion for foreign assets, figures very close to my own.

By this standard, many US and foreign banks are effectively insolvent and will have to be taken over by governments. The credit crunch will last much longer if we keep zombie banks alive despite their massive and continuing losses.

Given this outlook for the real economy and financial institutions, the latest rally in US and global stock markets has to be interpreted as a bear-market rally. Economists usually joke that the stock market has predicted 12 out of the last nine recessions, as markets often fall sharply without an ensuing recession.

But, in the last two years, the stock market has predicted six out of the last zero economic recoveries -- that is, six bear market rallies that eventually fizzled and led to new lows.

The stock market's latest 'dead cat bounce' may last a while longer, but three factors will, in due course, lead it to turn south again. First, macroeconomic indicators will be worse than expected, with growth failing to recover as fast as the consensus expects.

Second, the profits and earnings of corporations and financial institutions will not rebound as fast as the consensus predicts, as weak economic growth, deflationary pressures and surging defaults on corporate bonds will limit firms' pricing power and keep profit margins low.

Third, financial shocks will be worse than expected.

At some point, investors will realise that bank losses are massive, and that some banks are insolvent. Deleveraging by highly leveraged firms -- such as hedge funds -- will lead them to sell illiquid assets in illiquid markets. And some emerging market economies -- despite massive IMF support -- will experience a severe financial crisis with contagious effects on other economies.

So, while this latest bear-market rally may continue for a bit longer, renewed downward pressure on stocks and other risky assets is inevitable.

To be sure, much more aggressive policy action (massive and unconventional monetary easing, larger fiscal-stimulus packages, bailouts of financial firms, individual mortgage-debt relief, and increased financial support for troubled emerging markets) in many countries in the last few months has reduced the risk of a near depression. That outcome seemed highly likely six months ago, when global financial markets nearly collapsed.

Still, this global recession will continue for a longer period than the consensus suggests. There may be light at the end of the tunnel -- no depression and financial meltdown. But economic recovery everywhere will be weaker and will take longer than expected. The same is true for a sustained recovery of financial markets.

Nouriel Roubini is professor of economics at the Stern School of Business, New York University, and chairman of RGE Monitor. Copyright: Project Syndicate, 2009.

Access to some RGE EconoMonitors, including Nouriel Roubini's Global EconoMonitor, is reserved for registered users, so sign up now to read and comment on current postings. These writings are only a small part of the insights and commentary available through RGE Monitor. Contact us today at info@rgemonitor.com or 212.645.0010 to learn more about becoming a full subscriber.
Go Check it Out.

Bob DeMarco is a citizen journalist and twenty year Wall Street veteran. Bob has written more than 500 articles with more than 11,000 links to his work on the Internet. Content from All American Investor has been syndicated on Reuters, the Wall Street Journal, Fox News, Pluck, Blog Critics, and a growing list of newspaper websites. Bob is actively seeking syndication and writing assignments.


More from All American Investor


Follow All American Investor on Twitter

Durable Goods, New Orders, Shipments, Inventories


Minimal reaction in the market immediately after report.

New Orders

New orders for manufactured durable goods in March decreased $1.3 billion or 0.8 percent to $161.2 billion, the U.S. Census Bureau announced today. This was the seventh decrease in the last eight months and followed a 2.1 percent February increase. Excluding transportation, new orders decreased 0.6 percent. Excluding defense, new orders also decreased 0.6 percent.

Shipments


Shipments of manufactured durable goods in March, down eight consecutive months, decreased $3.0 billion or 1.7 percent to $175.0 billion. This followed a 0.8 percent February decrease.

Unfilled Orders

Unfilled orders for manufactured durable goods in March, down six consecutive months, decreased $11.2 billion or 1.4 percent to $760.3 billion. This followed a 1.6 percent February decrease.

Inventories

Inventories of manufactured durable goods in March, down three consecutive months, decreased $3.7 billion or 1.1 percent to $331.6 billion. This followed a 1.3 percent February decrease.

Capital Goods Industries

Nondefense

Nondefense new orders for capital goods in March increased $1.0 billion or 1.9 percent to $52.0 billion.

Defense

Defense new orders for capital goods in March decreased $1.4 billion or 14.4 percent to $8.6 billion.
Subscribe to All American Investor via Email

Bear Bailout Cost Fed $3 Billion, So Far


The U.S. Federal Reserve report showed a $3 billion loss on the books from its deal to rescue investment bank Bear Stearns.

The number of greater concern is The Fed's combined assets of $2.25 Trillion as of Dec. 31. This number compares with $1.3 Trillion a year earlier.

The Fed balance sheet is inflationary and anyone who believe otherwise has their head in the sand.

We continue to watch the yield on the Ten Year and Thirty Year Treasury closely. We will be looking at the yield curve and its implications tomorrow.

Fed data shows big losses on Bear Stearns deal
Subscribe to All American Investor via Email


Bob DeMarco is a citizen journalist and twenty year Wall Street veteran. Bob has written more than 500 articles with more than 11,000 links to his work on the Internet. Content from All American Investor has been syndicated on Reuters, the Wall Street Journal, Fox News, Pluck, Blog Critics, and a growing list of newspaper websites. Bob is actively seeking syndication and writing assignments.


More from All American Investor


Follow All American Investor on Twitter

Thursday, April 23, 2009

Stock Market Uptrend Still In Tact (Chart)


S andf P 500 Chart 423

As evidenced by the chart, the uptrend in the S and p 500 is continuing.

This weeks test of the green line shows that support under the market is continuing to build.

One area of concern is the six straight up weeks in the market. Statistically this is unusual and rarely seen -- even in bull markets.

It will be interesting to see if the market can make it seven in a row this week.

There is serious overhead resistance right at and above current levels. It appears the market needs a catalyst to move out of this congestion.

A close about 875 is needed to bring the momentum back into the market.

We are waiting for the red line to turn up before turning on the bullish enthusiasm.
Subscribe to All American Investor via Email


Bob DeMarco is a citizen journalist and twenty year Wall Street veteran. Bob has written more than 500 articles with more than 11,000 links to his work on the Internet. Content from All American Investor has been syndicated on Reuters, the Wall Street Journal, Fox News, Pluck, Blog Critics, and a growing list of newspaper websites. Bob is actively seeking syndication and writing assignments.


More from All American Investor


Follow All American Investor on Twitter