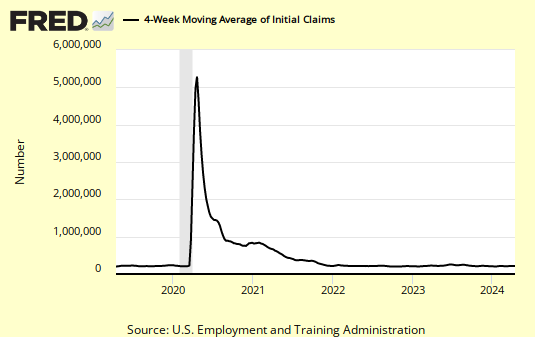
Next week we will be taking off 537,539. Any number below that figure will continue the downtrend in this series.
Subscribe to All American Investor via Email
Subscribe to All American Investor via Email

Subscribe to All American Investor via Email
 Bob DeMarco is a citizen journalist and twenty year Wall Street veteran. Bob has written more than 500 articles with more than 11,000 links to his work on the Internet. Content from All American Investor has been syndicated on Reuters, the Wall Street Journal, Fox News, Pluck, Blog Critics, and a growing list of newspaper websites. Bob is actively seeking syndication and writing assignments. Bob DeMarco is a citizen journalist and twenty year Wall Street veteran. Bob has written more than 500 articles with more than 11,000 links to his work on the Internet. Content from All American Investor has been syndicated on Reuters, the Wall Street Journal, Fox News, Pluck, Blog Critics, and a growing list of newspaper websites. Bob is actively seeking syndication and writing assignments. |
Subscribe to All American Investor via Email
| Bob DeMarco is a citizen journalist and twenty year Wall Street veteran. Bob has written more than 500 articles with more than 11,000 links to his work on the Internet. Content from All American Investor has been syndicated on Reuters, the Wall Street Journal, Fox News, Pluck, Blog Critics, and a growing list of newspaper websites. Bob is actively seeking syndication and writing assignments. |
The chart below shows the index levels for the U.S. National Home Price Index, as well as its annual returns. As of March 2009, average home prices across the United States are at similar levels to what they were in the fourth quarter of 2002. From the peak in the second quarter of 2006, average home prices are down 32.2%.

Subscribe to All American Investor via Email
| Bob DeMarco is a citizen journalist and twenty year Wall Street veteran. Bob has written more than 500 articles with more than 11,000 links to his work on the Internet. Content from All American Investor has been syndicated on Reuters, the Wall Street Journal, Fox News, Pluck, Blog Critics, and a growing list of newspaper websites. Bob is actively seeking syndication and writing assignments. |

Subscribe to All American Investor via Email
Bob DeMarco is a citizen journalist and twenty year Wall Street veteran. Bob has written more than 500 articles with more than 11,000 links to his work on the Internet. Content from All American Investor has been syndicated on Reuters, the Wall Street Journal, Fox News, Pluck, Blog Critics, and a growing list of newspaper websites. Bob is actively seeking syndication and writing assignments.Bob DeMarco, All American Investor, May 2009
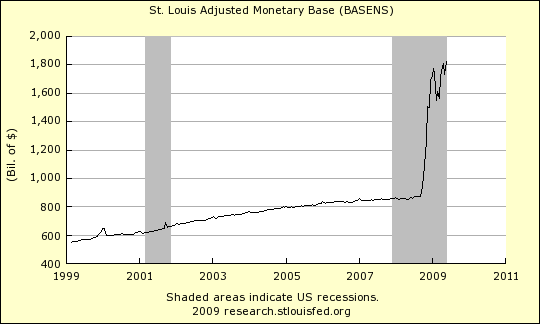
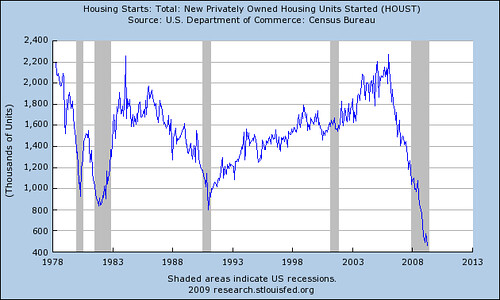
Subscribe to All American Investor via EmailWhen I looked at this chart this thought came to my mind -- get under your desk.
| Bob DeMarco is a citizen journalist and twenty year Wall Street veteran. Bob has written more than 500 articles with more than 11,000 links to his work on the Internet. Content from All American Investor has been syndicated on Reuters, the Wall Street Journal, Fox News, Pluck, Blog Critics, and a growing list of newspaper websites. Bob is actively seeking syndication and writing assignments. |
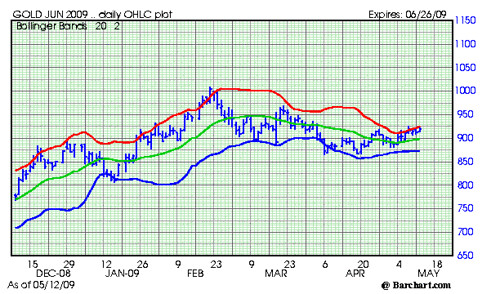
Gold is a special commodity in that the fundamentals of physical supply and demand are minor influences on its price. Gold’s price is most often driven by speculative demand for a hedge against inflation or economic uncertainty. Many investors see gold as a substitute for fiat currencies. Consequently, gold prices sometimes track changes in central bank holdings of gold.Source RGE Monitor Newsletter and RGE Monitor
Gold markets largely ignored China’s surprise revelation that it had increased its gold reserves as much of this had already been priced in by speculators. Moreover, China produces its own gold. The increase in China's gold holdings is just a mere drop in the bucket of its total $1.9 trillion in foreign exchange reserves. Gold's share in China's foreign exchange reserves remains much lower than the global average and well below the U.S. share. But China's interest in gold is consistent with its taste for real assets to gradually diversify from its U.S. bond-heavy portfolio. If other central banks followed suit, gold demand could increase sharply.
IMF gold sales will likely have little impact on gold prices if it sells its gold to central banks rather than the free market. The European Central Bank Gold Agreement’s expiration in September 2009 may have more impact. The signatories are likely to renew the agreement and continue limiting central bank gold sales. Fears that monetization of rising public debts will erode currency values may spark demand for gold as an inflation hedge.
Subscribe to All American Investor via Email
| Bob DeMarco is a citizen journalist and twenty year Wall Street veteran. Bob has written more than 500 articles with more than 11,000 links to his work on the Internet. Content from All American Investor has been syndicated on Reuters, the Wall Street Journal, Fox News, Pluck, Blog Critics, and a growing list of newspaper websites. Bob is actively seeking syndication and writing assignments. |
Now, imagine a world in which China could borrow and lend internationally in its own currency. The renminbi, rather than the dollar, could eventually become a means of payment in trade and a unit of account in pricing imports and exports, as well as a store of value for wealth by international investors. Americans would pay the price. We would have to shell out more for imported goods, and interest rates on both private and public debt would rise. The higher private cost of borrowing could lead to weaker consumption and investment, and slower growth.Also see Roubini vs. Zhou on the U.S. Dollar and the Chinese Yuan
Subscribe to All American Investor via Email
| Bob DeMarco is a citizen journalist and twenty year Wall Street veteran. Bob has written more than 500 articles with more than 11,000 links to his work on the Internet. Content from All American Investor has been syndicated on Reuters, the Wall Street Journal, Fox News, Pluck, Blog Critics, and a growing list of newspaper websites. Bob is actively seeking syndication and writing assignments. |
The price of fresh eggs jumped 44 percent, the most since records began in 1992.
Energy goods increased 0.7 percent.
The price of food jumped 1.5 percent.
Producer prices (PPI) rose .3 percent.
Initial jobless claims rose by 32,000 to 637,000 in the week ended May 9, from a revised 605,000 the prior week.
Subscribe to All American Investor via Email
| Bob DeMarco is a citizen journalist and twenty year Wall Street veteran. Bob has written more than 500 articles with more than 11,000 links to his work on the Internet. Content from All American Investor has been syndicated on Reuters, the Wall Street Journal, Fox News, Pluck, Blog Critics, and a growing list of newspaper websites. Bob is actively seeking syndication and writing assignments. |
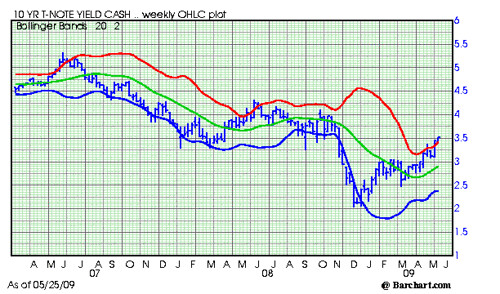
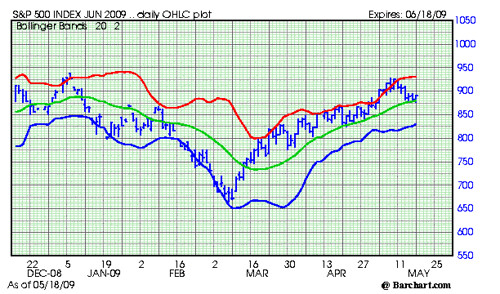
- A major retracement to the downside is likely, and is imminent.
- The bottom line. The risks out weigh the rewards at this level.

Subscribe to All American Investor via Email
| Bob DeMarco is a citizen journalist and twenty year Wall Street veteran. Bob has written more than 500 articles with more than 11,000 links to his work on the Internet. Content from All American Investor has been syndicated on Reuters, the Wall Street Journal, Fox News, Pluck, Blog Critics, and a growing list of newspaper websites. Bob is actively seeking syndication and writing assignments. |

Subscribe to All American Investor via Email
The U.S. Census Bureau announced today that advance estimates of U.S. retail and food services sales for April, adjusted for seasonal variation and holiday and trading-day differences, but not for price changes, were $337.7 billion, a decrease of 0.4 percent (±0.5%)* from the previous month and 10.1 percent (±0.7%) below April 2008. Total sales for the February through April 2009 period were down 9.2 percent (±0.5%) from the same period a year ago. The February to March 2009 percent change was revised from -1.2 percent (±0.5%) to -1.3 percent (±0.3%).
Retail trade sales were down 0.4 percent (±0.7%)* from March 2009 and 11.4 percent (±0.7%) below last year. Gasoline stations sales were down 36.4 percent (±1.5%) from April 2008 and motor vehicle and parts dealers sales were down 20.7 percent (±2.3%) from last year.
Subscribe to All American Investor via Email
Subscribe to All American Investor via EmailThe market place is now starting to focus on the potential inflationary impact of the policies being carried out by the Federal Reserve and Treasury. The money supply, Fed balance sheet, and reserve balances are all soaring. The Treasury is buying mortgage backed securities and treasuries in an attempt to keep interest rates artificially low.
| Bob DeMarco is a citizen journalist and twenty year Wall Street veteran. Bob has written more than 500 articles with more than 11,000 links to his work on the Internet. Content from All American Investor has been syndicated on Reuters, the Wall Street Journal, Fox News, Pluck, Blog Critics, and a growing list of newspaper websites. Bob is actively seeking syndication and writing assignments. |

Subscribe to All American Investor via Email

Subscribe to All American Investor via Email
 Source Treehugger
Subscribe to All American Investor via Email

Subscribe to All American Investor via Email
| Bob DeMarco is a citizen journalist and twenty year Wall Street veteran. Bob has written more than 500 articles with more than 11,000 links to his work on the Internet. Content from All American Investor has been syndicated on Reuters, the Wall Street Journal, Fox News, Pluck, Blog Critics, and a growing list of newspaper websites. Bob is actively seeking syndication and writing assignments. |

Subscribe to All American Investor via Email
| Bob DeMarco is a citizen journalist and twenty year Wall Street veteran. Bob has written more than 500 articles with more than 11,000 links to his work on the Internet. Content from All American Investor has been syndicated on Reuters, the Wall Street Journal, Fox News, Pluck, Blog Critics, and a growing list of newspaper websites. Bob is actively seeking syndication and writing assignments. |
Marginally attached workers are persons who currently are neither working nor looking for work but indicate that they want and are available for a job and have looked for work sometime in the recent past. Discouraged workers, a subset of the marginally attached,have given a job-market related reason for not looking currently for a job.The U-6 report counts everyone that is unemployed. To view the report go here.
Subscribe to All American Investor via Email
| Bob DeMarco is a citizen journalist and twenty year Wall Street veteran. Bob has written more than 500 articles with more than 11,000 links to his work on the Internet. Content from All American Investor has been syndicated on Reuters, the Wall Street Journal, Fox News, Pluck, Blog Critics, and a growing list of newspaper websites. Bob is actively seeking syndication and writing assignments. |
Discouraged workers are persons not currently looking for work because they believe no jobs are available for them.The other 1.4 million persons marginally attached to the labor force in April had not searched for work in the 4 weeks preceding the survey for reasons such as school attendance or family responsibilities.
Subscribe to All American Investor via Email
| Bob DeMarco is a citizen journalist and twenty year Wall Street veteran. Bob has written more than 500 articles with more than 11,000 links to his work on the Internet. Content from All American Investor has been syndicated on Reuters, the Wall Street Journal, Fox News, Pluck, Blog Critics, and a growing list of newspaper websites. Bob is actively seeking syndication and writing assignments. |
Subscribe to All American Investor via Email

Subscribe to All American Investor via Email
| Bob DeMarco is a citizen journalist and twenty year Wall Street veteran. Bob has written more than 500 articles with more than 11,000 links to his work on the Internet. Content from All American Investor has been syndicated on Reuters, the Wall Street Journal, Fox News, Pluck, Blog Critics, and a growing list of newspaper websites. Bob is actively seeking syndication and writing assignments. |

Subscribe to All American Investor via Email

Subscribe to All American Investor via Email
| Bob DeMarco is a citizen journalist and twenty year Wall Street veteran. Bob has written more than 500 articles with more than 11,000 links to his work on the Internet. Content from All American Investor has been syndicated on Reuters, the Wall Street Journal, Fox News, Pluck, Blog Critics, and a growing list of newspaper websites. Bob is actively seeking syndication and writing assignments. |