Google

Wednesday, June 24, 2009

Mortgage Applications Survey and Interest Rates 624


Share/Save/Bookmark
The Mortgage Bankers Association (MBA) today released its Weekly Mortgage Applications Survey for the week ending June 19, 2009. The Market Composite Index, a measure of mortgage loan application volume, was 548.2, an increase of 6.6 percent on a seasonally adjusted basis from 514.4 one week earlier.

The four week moving average for the seasonally adjusted Market Index is down 9.3 percent.

The Refinance Index increased 5.9 percent to 2116.3 from 1998.1 the previous week and the seasonally adjusted Purchase Index increased 7.3 percent to 280.3 from 261.2 one week earlier.

The average contract interest rate for 30-year fixed-rate mortgages decreased to 5.44 percent from 5.50 percent, with points increasing to 0.99 from 0.89 (including the origination fee) for 80 percent loan-to-value (LTV) ratio loans.

Source: Mortgage Bankers Association
Subscribe to All American Investor via Email

Bob DeMarco is a citizen journalist and twenty year Wall Street veteran. Bob has written more than 700 articles with more than 18,000 links to his work on the Internet. Content from All American Investor has been syndicated on Reuters, the Wall Street Journal, Fox News, Pluck, Blog Critics, and a growing list of newspaper websites. Bob is actively seeking syndication and writing assignments.


More from All American Investor


Follow All American Investor on Twitter

Friday, June 19, 2009

Real Unemployment: 14 Million Americans Now Unemployed (Graphs)


Share/Save/Bookmark

Last week two popular measures of unemployment were reported: weekly unemployment claims (608,000) and the four week moving average of unemployment (615,750). Both showed that the number of people applying for unemployment insurance had dropped week over week.


The previous week another popular measure of employment --the civilian unemployment rate--jumped to 9.4 percent from 8.9 percent.

One number that is rarely reported in the popular media is the actual number of people that are unemployed. You might be shocked to learn that the number of unemployed workers soared to 14.5 million in the most recent report. This compares to 13.72 million the previous month, and 8.5 million a year earlier.

Source: The Employment Situation--Unemployed


While the more popular reports seem to be indicating that the employment situation is improving, the raw numbers show that more and more Americans are out of work. In fact, this is the largest number of unemployed since they started compiling this statistic in 1948.

Another sobering statistic is the number of Americans that have been unemployed for 27 weeks or longer. This number rose to 3.95 million in the latest period, versus 3.68 million a month earlier. In 2008, the number for the comparable period was 1.57 million.

Source: Civilians Unemployed for 27 Weeks and Over


These numbers are particularly disconcerting because many of these Americans have exhausting their Federal and State unemployment insurance benefits.

With the trend of unemployment still rising and the duration of unemployment still rising, the situation is more dire than it appears on the surface.

Many of the so called experts continue to say that the employment situation is improving based on weekly unemployment claims report. The evidence (although lagging) paints a very different picture of employment in America.

Those investing in stocks should take a good hard look at these numbers. The numbers are telling us that the economy is still at risk.

While the employment situation might not be as bad as it was a few months ago, the situation is still very negative.

It is often true that the stock markets discounts all the bad news before it happens. But the question still remains, has the market discounted the worst of the news, or is the worst news still to come?
Subscribe to All American Investor via Email

Bob DeMarco is a citizen journalist and twenty year Wall Street veteran. Bob has written more than 700 articles with more than 18,000 links to his work on the Internet. Content from All American Investor has been syndicated on Reuters, the Wall Street Journal, Fox News, Pluck, Blog Critics, and a growing list of newspaper websites. Bob is actively seeking syndication and writing assignments.


More from All American Investor


Follow All American Investor on Twitter

Money Supply Climbs to New High (M2, Graph)


Share/Save/Bookmark

Subscribe to All American Investor via Email


Bob DeMarco is a citizen journalist and twenty year Wall Street veteran. Bob has written more than 700 articles with more than 18,000 links to his work on the Internet. Content from All American Investor has been syndicated on Reuters, the Wall Street Journal, Fox News, Pluck, Blog Critics, and a growing list of newspaper websites. Bob is actively seeking syndication and writing assignments.


More from All American Investor


Follow All American Investor on Twitter

Thursday, June 18, 2009

Economist Samuelson Warns about China Pessimism and a Run on the Dollar


Share/Save/Bookmark
These are sobering words from renowned economist Paul Samuelson.
Some day -- maybe even soon -- China will turn pessimistic on the U.S. dollar.

That means lethal troubles for the future U.S. economy.

When a disorderly run against the dollar occurs, I believe a truly global financial panic is to be feared. China, Japan and Korea now hold dollars not because they think dollars will stay safe.

Why then?.....
The threat that China and others countries might divest the dollar is starting to cause jitters in the Treasury market. If the countries Samuelson mentioned held on to their dollar assets --but cut back on their purchases of U.S. Treasuries-- interest rates higher immediately.

The given in this equation is that the amounts of Treasuries coming on to the market in the years ahead is enormous.

Growing supply, and the likelihood that U. S. Treasury debt will get downgraded, means that the risk premium for owning longer dated treasuries is likely to rise and rise sharply.

During the early 1990s this risk premium rose to more than five percent.

Lets say we find ourselves with a three percent inflation rate in the next 12-18 months. What is the rate we could see in the ten years treasury?

8-11 percent. Inflation, inflation expectation, dollar risk, supply, plus a fair rate of interest all add to the interest rate that investors will demand in order to buy. It is not hard to envision five or more points of risk premium.

Does it make good sense in this environment to be fully invested in stocks?

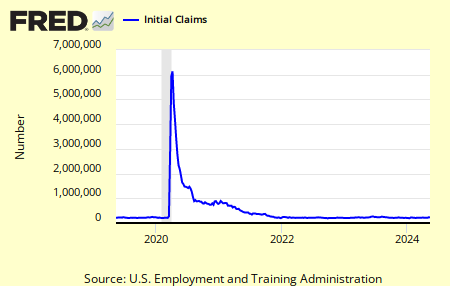
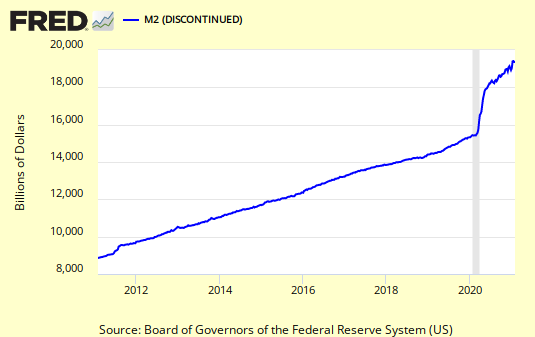
My guess is that we are going to see a sharp uptick in inflation in the next 12-18 months. Given the enormous expansion in the money supply it is not hard to envision three percent inflation. Add in the necessary risk premium for owning longer dated securities, and it is not hard to envision sharply higher rates.

Right now most analysts continue to mention how inflation is not a problem. In 1980, when inflation was hitting 1.5 percent per month, analysts were forecasting higher inflation and higher interest rates in the future. Inflation peaked right then and right there.

Our we at the trough in inflation now?

Anybody old enough to remember when the ten year treasury yield was above 15 percent? Three month treasury bill at 14 percent?

It is time to be risk adverse. Not the time to be betting the ranch in the stock market.

To read the entire Samuelson article go here.
Subscribe to All American Investor via Email

Bob DeMarco is a citizen journalist and twenty year Wall Street veteran. Bob has written more than 700 articles with more than 18,000 links to his work on the Internet. Content from All American Investor has been syndicated on Reuters, the Wall Street Journal, Fox News, Pluck, Blog Critics, and a growing list of newspaper websites. Bob is actively seeking syndication and writing assignments.


More from All American Investor


Follow All American Investor on Twitter

Mortgage Market Deteriorates - Refinancing and Loan Rates


Share/Save/Bookmark
Are higher interesting rates effecting refinancing? Is the Housing Market picking up?

Refinancing
  • The Refinance Index dropped 23.3 percent to 1998.1 from 2605.7.
  • The four week moving average for the seasonally adjusted Refinance Index is down 19.6 percent.
  • The refinance share of mortgage activity decreased to 54.1 percent of total applications from 59.4 percent the previous week.
Mortgage Loans
  • The Market Composite Index, a measure of mortgage loan application volume, was 514.4, a decrease of 15.8 percent on a seasonally adjusted basis from 611.0 one week earlier.
  • The four week moving average for the seasonally adjusted Market Index is down 13.5 percent. The Purchase Index decreased 3.5 percent to 261.2 from 270.7 one week earlier.
***Mortgage Bankers Association (MBA)Weekly Mortgage Applications Survey for the week ending June 12, 2009.
Subscribe to All American Investor via Email

Tuesday, June 16, 2009

Mortgage Interest Rates Go Verticle (Graph)


Share/Save/Bookmark

The negative implications of the sharp rise in mortgage interest rates are to many to list. When interest rates rise house get more expensive. This is likely to slow the economic recovery in housing -- a real negative. Another likely outcome is the end of the refinancing boom.

Let's not forget, the Treasury has been in the markets buying Treasury securities and mortgage backed securities. As we have pointed out for many months, the Treasury balance sheet is exploding with no end in sight. Rates continue to rise against this background.

It should be clear that there is little or nothing that the FED and Treasury can do to stem the rise in longer dated securities.

Here is another little noticed fact that we will be writing about soon. Since June 1, the two year treasury has risen 26 basis points, while the ten year treasury has dropped 4 basis points. This means the yield curve is flattening. Go here for the Daily Treasury Yield Curve Rates.

My guess is in the next 12-18 months the market will realize that stagflation is the name of the game.

This is the worst thing that can happen to the dollar. The only thing that could stem a run on the dollar is FED tightening.
Subscribe to All American Investor via Email

Bob DeMarco is a citizen journalist and twenty year Wall Street veteran. Bob has written more than 500 articles with more than 11,000 links to his work on the Internet. Content from All American Investor has been syndicated on Reuters, the Wall Street Journal, Fox News, Pluck, Blog Critics, and a growing list of newspaper websites. Bob is actively seeking syndication and writing assignments.


More from All American Investor


Follow All American Investor on Twitter

Housing Starts Graph and Statistics


Share/Save/Bookmark
Housing Starts


Subscribe to All American Investor via Email

The U.S. Census Bureau and the Department of Housing and Urban Development jointly announced the following new residential construction statistics for May 2009.

BUILDING PERMITS
  • Privately-owned housing units authorized by building permits in May were at a seasonally adjusted annual rate of 518,000.
  • This is 4.0 percent above the revised April rate of 498,000, but is 47.0 percent below the May 2008 estimate of 978,000.
  • Single-family authorizations in May were at a rate of 408,000; this is 7.9 percent above the revised April figure of 378,000.

HOUSING STARTS
  • Privately-owned housing starts in May were at a seasonally adjusted annual rate of 532,000.
  • This is 17.2 percent above the revised April estimate of 454,000, but is 45.2 percent below the May 2008 rate of 971,000.
  • Single-family housing starts in May were at a rate of 401,000; this is 7.5 percent above the revised April figure of 373,000.
  • The May rate for units in buildings with five units or more was 124,000.
HOUSING COMPLETIONS
  • Privately-owned housing completions in May were at a seasonally adjusted annual rate of 811,000. This is 3.3 percent.
  • below the revised April estimate of 839,000 and is 28.8 percent below the May 2008 rate of 1,139,000.
  • Single-family housing completions in May were at a rate of 491,000; this is 9.4 percent below the revised April figure of 542,000.
  • The May rate for units in buildings with five units or more was 314,000.

Bob DeMarco is a citizen journalist and twenty year Wall Street veteran. Bob has written more than 500 articles with more than 11,000 links to his work on the Internet. Content from All American Investor has been syndicated on Reuters, the Wall Street Journal, Fox News, Pluck, Blog Critics, and a growing list of newspaper websites. Bob is actively seeking syndication and writing assignments.


More from All American Investor

Kindle: Amazon's 6" Wireless Reading Device


Follow All American Investor on Twitter

Saturday, June 13, 2009

FED Loans to AIG for Credit Default Swaps (Maiden Lane III, Graph)


Share/Save/Bookmark
On November 25, 2008, the Federal Reserve Bank of New York began extending credit to Maiden Lane III LLC.

This limited liability company was formed to purchase multi-sector collateralized debt obligations (CDOs) on which the Financial Products group of American International Group, Inc (AIG) had written credit default swap (CDS) contracts.

Net portfolio holding of Maiden Lane III at peak $28.085 billion (December 24, 2008). Current holding $19.876 billion.

FED continuing to assume risks of these credit default swap transactions.

Subscribe to All American Investor via Email


Bob DeMarco is a citizen journalist and twenty year Wall Street veteran. Bob has written more than 500 articles with more than 11,000 links to his work on the Internet. Content from All American Investor has been syndicated on Reuters, the Wall Street Journal, Fox News, Pluck, Blog Critics, and a growing list of newspaper websites. Bob is actively seeking syndication and writing assignments.


More from All American Investor

Kindle: Amazon's 6" Wireless Reading Device


Follow All American Investor on Twitter

Money Supply Steady Climb Continues (M2, Graph)


Share/Save/Bookmark


Sooner or later the FEDs resolve on keeping inflation low is going to be tested. If the market place senses that the FED has lost its resolve as "inflation cops" interest rates are likely to soar.

M2 includes a broader set of financial assets held principally by households. M2 consists of M1 plus: (1) savings deposits (which include money market deposit accounts, or MMDAs); (2) small-denomination time deposits (time deposits in amounts of less than $100,000); and (3) balances in retail money market mutual funds (MMMFs). Seasonally adjusted M2 is computed by summing savings deposits, small-denomination time deposits, and retail MMMFs, each seasonally adjusted separately, and adding this result to seasonally adjusted M1.
Subscribe to All American Investor via Email

Bob DeMarco is a citizen journalist and twenty year Wall Street veteran. Bob has written more than 500 articles with more than 11,000 links to his work on the Internet. Content from All American Investor has been syndicated on Reuters, the Wall Street Journal, Fox News, Pluck, Blog Critics, and a growing list of newspaper websites. Bob is actively seeking syndication and writing assignments.


More from All American Investor

Kindle: Amazon's 6" Wireless Reading Device


Follow All American Investor on Twitter

FED Bank Reserve Credit (Graph)


Share/Save/Bookmark


Reserve Bank credit is the sum of securities held outright, repurchase agreements, term auction credit, other loans, net portfolio holdings of Commercial Paper Funding Facility LLC, net portfolio holdings of LLCs funded through the Money Market Investor Funding Facility, net portfolio holdings of Maiden Lane LLC, net portfolio holdings of Maiden Lane II LLC, net portfolio holdings of Maiden Lane III LLC, float, central bank liquidity swaps, and other Federal Reserve assets.
Subscribe to All American Investor via Email


More from All American Investor

Kindle: Amazon's 6" Wireless Reading Device


Follow All American Investor on Twitter

FED Net Free or Borrowed Reserves Soaring (Graph)


Share/Save/Bookmark


Excess reserves minus discount window borrowings plus secondary borrowings.
Subscribe to All American Investor via Email

Bob DeMarco is a citizen journalist and twenty year Wall Street veteran. Bob has written more than 500 articles with more than 11,000 links to his work on the Internet. Content from All American Investor has been syndicated on Reuters, the Wall Street Journal, Fox News, Pluck, Blog Critics, and a growing list of newspaper websites. Bob is actively seeking syndication and writing assignments.


Kindle: Amazon's 6" Wireless Reading Device

Friday, June 12, 2009

Monetary Base Continues to Soar (Graph)


Share/Save/Bookmark

Subscribe to All American Investor via Email

This chart helps explain why investors are increasingly worried about future inflation. The adjusted monetary base has nearly doubled since April, 2008. In comparison, the moneatry base doubled once from January, 1994 to October, 2005.

Bob DeMarco is a citizen journalist and twenty year Wall Street veteran. Bob has written more than 500 articles with more than 11,000 links to his work on the Internet. Content from All American Investor has been syndicated on Reuters, the Wall Street Journal, Fox News, Pluck, Blog Critics, and a growing list of newspaper websites. Bob is actively seeking syndication and writing assignments.


More from All American Investor

Kindle: Amazon's 6" Wireless Reading Device


Follow All American Investor on Twitter

Real Retail and Food Services (Graph)


Share/Save/Bookmark


Not a pretty picture. It will be interesting to watch this series in the next few months. No real surprise here. The trend remains down, but could be bottoming.

***Deflated Using the Consumer Price Index for All Urban Consumers (1982-84=100)
Subscribe to All American Investor via Email

Bob DeMarco is a citizen journalist and twenty year Wall Street veteran. Bob has written more than 500 articles with more than 11,000 links to his work on the Internet. Content from All American Investor has been syndicated on Reuters, the Wall Street Journal, Fox News, Pluck, Blog Critics, and a growing list of newspaper websites. Bob is actively seeking syndication and writing assignments.


More from All American Investor

Kindle: Amazon's 6" Wireless Reading Device


Follow All American Investor on Twitter

Thursday, June 11, 2009

6,816,000 Americans on the Dole


Share/Save/Bookmark
Sometime you have to look beyond the obvious. Continuing claims for unemployment set a record for the 19th consecudtive week. Nearly 6.82 million American are now receiving unemployment checks weekly. What happens when the benefits run out?

UNEMPLOYMENT INSURANCE WEEKLY CLAIMS REPORT

In the week ending June 6, the advance figure for seasonally adjusted initial claims was 601,000, a decrease of 24,000 from the previous week's revised figure of 625,000. The 4-week moving average was 621,750, a decrease of 10,500 from the previous week's revised average of 632,250.

The advance seasonally adjusted insured unemployment rate was 5.1 percent for the week ending May 30, unchanged from the prior week's revised rate of 5.1 percent.

The advance number for seasonally adjusted insured unemployment during the week ending May 30 was 6,816,000, an increase of 59,000 from the preceding week's revised level of 6,757,000. The 4-week moving average was 6,750,500, an increase of 57,250 from the preceding week's revised average of 6,693,250.

The fiscal year-to-date average for seasonally adjusted insured unemployment for all programs is 5.238 million.

Source Department of Labor
Subscribe to All American Investor via Email


Bob DeMarco is a citizen journalist and twenty year Wall Street veteran. Bob has written more than 500 articles with more than 11,000 links to his work on the Internet. Content from All American Investor has been syndicated on Reuters, the Wall Street Journal, Fox News, Pluck, Blog Critics, and a growing list of newspaper websites. Bob is actively seeking syndication and writing assignments.


More from All American Investor

Kindle: Amazon's 6" Wireless Reading Device


Follow All American Investor on Twitter

Tuesday, June 09, 2009

The Housing and Credit Crisis Explained


Share/Save/Bookmark
This presentation on the Housing and Credit crisis is the best I have seen. It explains everything from soup to nuts.

Each slide contains a graph that is well explained.

They say a picture is worth a thousand words.

Once you get through this, you will understanding the current credit crisis in housing, and what to expect in the years ahead.

If you take the time to view and read this you will be fully informed.

Hit the full screen button in the upper right hand corner of the panel below.

T2 Partners Presentation on the Mortgage Crisis

Subscribe to All American Investor via Email


Bob DeMarco is a citizen journalist and twenty year Wall Street veteran. Bob has written more than 500 articles with more than 11,000 links to his work on the Internet. Content from All American Investor has been syndicated on Reuters, the Wall Street Journal, Fox News, Pluck, Blog Critics, and a growing list of newspaper websites. Bob is actively seeking syndication and writing assignments.


More from All American Investor

Kindle: Amazon's 6" Wireless Reading Device


Follow All American Investor on Twitter

Sunday, June 07, 2009

Total Consumer Credit Outstanding Continues to Drop (Graph)


Share/Save/Bookmark
As you can see from the graph, Total Consumer Credit Outstanding Continues to Drop. This is an unusual pattern. After nine months down, we are now back to a level last seen during December, 2007.

If the trend continues at this pace, it will have a negative impact on GDP in the months ahead. This will certainly have an impact on future economic forecasts, consumption, and consumer spending.

Subscribe to All American Investor via Email

Bob DeMarco is a citizen journalist and twenty year Wall Street veteran. Bob has written more than 500 articles with more than 11,000 links to his work on the Internet. Content from All American Investor has been syndicated on Reuters, the Wall Street Journal, Fox News, Pluck, Blog Critics, and a growing list of newspaper websites. Bob is actively seeking syndication and writing assignments.


More from All American Investor

Kindle: Amazon's 6" Wireless Reading Device


Follow All American Investor on Twitter

Saturday, June 06, 2009

Bond Vigilantes Take over in the Long End (Graph)


Share/Save/Bookmark
30 Year Bond Infaltion Vigilantes Take Over (Graph)

If you were around during the 1980s you know all about the bond vigilantes. When inflation is on the horizon they take over in the long end of the Treasury market.

The 30 year chart above shows that institutional investors are worried about the current policies of the Federal Reserve and Treasury. When this occurs, a interest rate risk premium gets built into the bond. In other words, investors want a bigger cushion to accept the risk of investing in long term Treasury Bonds.

These interest rates look high in comparison to recent history. However, if you are old enough you will remember when the long bond traded above 15 percent. Right now, if you told someone you believed that could happen again, they would tell you -- you are nuts.

They told me I was nuts when I wrote about fire not smoke, when the S and P 500 was in the 1250 area. Nobody thought we could see the stock market fall in half from those levels.

Over the next few years, talk about a downgrade of U.S. debt is going to increase. It appears right now that the downgrade is inevitable. However, it is probably two to four years in the future. The market will discount the downgrade before it happens.

Expect 30 year Treasury bond yields to continue to rise for the foreseeable future. Constant Treasury intervention to try and hold down long term interest rates will fail.

Remember when the Treasury intervened in the Gold market over and over to try and hold prices down?
Subscribe to All American Investor via Email


Bob DeMarco is a citizen journalist and twenty year Wall Street veteran. Bob has written more than 500 articles with more than 11,000 links to his work on the Internet. Content from All American Investor has been syndicated on Reuters, the Wall Street Journal, Fox News, Pluck, Blog Critics, and a growing list of newspaper websites. Bob is actively seeking syndication and writing assignments.


More from All American Investor


Kindle: Amazon's 6" Wireless Reading Device


Follow All American Investor on Twitter

Ten Year Treasury Yield in Orbit (Graph)


Share/Save/Bookmark
Ten Year Treasury Yield in Orbit (Graph)

The sharp rise in the Ten Year Treasury note yield will come as no surprise to readers of this blog. We forecasted this development, based on Federal Reserve and Treasury policy, several months ago when we pointed out that once the yield exceeded 3.125 percent, it was up up and away on our beautiful, beautiful money machine.

Our new song is, there ain't no stopping it now. Oh, the Treasury will come in and buy some size in longer dated Treasuries and mortgage back securities, forcing a short lived, temporary drop in rates from time to time.

As you can see if you look at the red line on the chart, this market continues to stay overbought. This is not a negative sign, quite the opposite, it signals the enormous strength of this trend up in interest rates.

Expect the Fed to defend the 4.00% with both hands and both feet. It will be interesting to see if they can stem the tide of rising interest rates in the longer end of the market.

This rise in ten year interest rates has lots of negative implications. However, the single biggest negative is simple --the refinancing boom is over. With mortgage rates well over 5 percent now, the economics won't work for the vast number of mortgage owners that refinanced in prior drops into the current area.
Subscribe to All American Investor via Email


Bob DeMarco is a citizen journalist and twenty year Wall Street veteran. Bob has written more than 500 articles with more than 11,000 links to his work on the Internet. Content from All American Investor has been syndicated on Reuters, the Wall Street Journal, Fox News, Pluck, Blog Critics, and a growing list of newspaper websites. Bob is actively seeking syndication and writing assignments.


More from All American Investor


Kindle: Amazon's 6" Wireless Reading Device

M2 Continues to Soar (Graph)


Share/Save/Bookmark

M2 soared to a new all time high $8,358.2 billions.

Gold rising, commodities rising, long term interest rates rising, no surprise.

H.6 -- M2 includes a broader set of financial assets held principally by households. M2 consists of M1 plus: (1) savings deposits (which include money market deposit accounts, or MMDAs); (2) small-denomination time deposits (time deposits in amounts of less than $100,000); and (3) balances in retail money market mutual funds (MMMFs). Seasonally adjusted M2 is computed by summing savings deposits, small-denomination time deposits, and retail MMMFs, each seasonally adjusted separately, and adding this result to seasonally adjusted M1.

Kindle: Amazon's 6" Wireless Reading Device

Friday, June 05, 2009

Real Unemployment Jumps to 16.4 Percent (Graph)


Share/Save/Bookmark
Not many people are aware of the U-6 report that is issued by the Bureau of Labor Statistics. Most news organizations report the more popular U.S. Department of Labor: Bureau of Labor Statistics--Civilian Unemployment Rate. If you read this report today then you learned that unemployment jumped to 9.4 percent.

Real Unemployment U-6 -- 16.4%

Source Bureau of Labor Statistics

There is another category of unemployed that are not counted in that report. They are described in the U-6 report this way,
Marginally attached workers are persons who currently are neither working nor looking for work but indicate that they want and are available for a job and have looked for work sometime in the recent past. Discouraged workers, a subset of the marginally attached,have given a job-market related reason for not looking currently for a job.
The U-6 report counts everyone that is unemployed. To view the report go here.
Subscribe to All American Investor via Email

U-6
  • Total unemployed
  • plus all marginally attached workers
  • plus total employed part time for economic reasons
  • as a percent of the civilian labor force plus all marginally attached workers
The number reported today for this series is 16.4% .

This paints a very ugly picture for the future.

Bob DeMarco is a citizen journalist and twenty year Wall Street veteran. Bob has written more than 500 articles with more than 11,000 links to his work on the Internet. Content from All American Investor has been syndicated on Reuters, the Wall Street Journal, Fox News, Pluck, Blog Critics, and a growing list of newspaper websites. Bob is actively seeking syndication and writing assignments.

Kindle: Amazon's 6" Wireless Reading Device

THE EMPLOYMENT SITUATION: MAY 2009


Share/Save/Bookmark
Nonfarm payroll employment fell by 345,000 in May, about half the
average monthly decline for the prior 6 months, the Bureau of Labor
Statistics of the U.S. Department of Labor reported today. The unem-
ployment rate continued to rise, increasing from 8.9 to 9.4 percent.
Steep job losses continued in manufacturing, while declines moderated
in construction and several service-providing industries.
Subscribe to All American Investor via Email


Unemployment (Household Survey Data)

The number of unemployed persons increased by 787,000 to 14.5 million
in May, and the unemployment rate rose to 9.4 percent. Since the start
of the recession in December 2007, the number of unemployed persons has
risen by 7.0 million, and the unemployment rate has grown by 4.5 percent-
age points. (See table A-1.)

Unemployment rates rose in May for adult men (9.8 percent), adult
women (7.5 percent), whites (8.6 percent), and Hispanics (12.7 percent).
The jobless rates for teenagers (22.7 percent) and blacks (14.9 percent)
were little changed over the month. The unemployment rate for Asians was
6.7 percent in May, not seasonally adjusted, up from 3.8 percent a year
earlier. (See tables A-1, A-2, and A-3.)

Among the unemployed, the number of job losers and persons who completed
temporary jobs rose by 732,000 in May to 9.5 million. This group has in-
creased by 5.8 million since the start of the recession. (See table A-8.)

The number of long-term unemployed (those jobless for 27 weeks or more)
increased by 268,000 over the month to 3.9 million and has tripled since
the start of the recession.
Bob DeMarco is a citizen journalist and twenty year Wall Street veteran. Bob has written more than 500 articles with more than 11,000 links to his work on the Internet. Content from All American Investor has been syndicated on Reuters, the Wall Street Journal, Fox News, Pluck, Blog Critics, and a growing list of newspaper websites. Bob is actively seeking syndication and writing assignments.

Kindle: Amazon's Wireless Reading Device (Latest Generation)


Follow All American Investor on Twitter

Thursday, June 04, 2009

Total Public Debt Continues to Soar Out of Control (Long Term Graph)


Share/Save/Bookmark
In regard to my previous post a reader wrote:
Why don't you show the whole truth? Show it since 1900. Show how the two biggest jumps after WW2 happened during the Reagan/H.W.Bush and W.Bush years.
This series dates back to 1966, that is all the available date.

Decide for yourself.


Kindle: Amazon's Wireless Reading Device (Latest Generation)