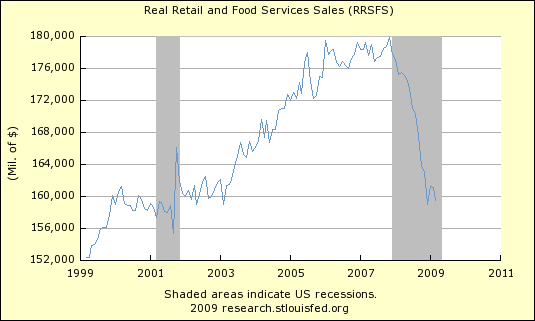
Note: Deflated Using the Consumer Price Index for All Urban Consumers (1982-84=100)
Real retail sales is a an important series. Retail sales accounts for two thirds of GDP. So far, the trend is not good as evidenced by this chart. After a nice month rally into January, the series has two straight months down.
Expectations are for a sharp turnaround in GDP. In order for that to occur, retail sales need to rise. The recent evidence coming in supports the idea that GDP is going to improve moving forward. For example, restaurant sales are improving.
Expectations are for a sharp turnaround in GDP. In order for that to occur, retail sales need to rise. The recent evidence coming in supports the idea that GDP is going to improve moving forward. For example, restaurant sales are improving.
Stocks are trending higher because much of the bad news had been discounted in the market. But, as the market moves higher expectations get discounted. Is the market getting ahead of itself.
The key word here is expectation. As a result, we will watch this series closely, and see how it compares to expectation.
Most numbers that are coming out will be better than the near term comparable number. However, the trend of the numbers is going to become a more important issue. Merely comparing numbers month over month is not going to tell us much.
Follow All American Investor on Twitter
Subscribe to All American Investor via Email
 Bob DeMarco is a citizen journalist and twenty year Wall Street veteran. Bob has written more than 500 articles with more than 11,000 links to his work on the Internet. Content from All American Investor has been syndicated on Reuters, the Wall Street Journal, Fox News, Pluck, Blog Critics, and a growing list of newspaper websites. Bob is actively seeking syndication and writing assignments. Bob DeMarco is a citizen journalist and twenty year Wall Street veteran. Bob has written more than 500 articles with more than 11,000 links to his work on the Internet. Content from All American Investor has been syndicated on Reuters, the Wall Street Journal, Fox News, Pluck, Blog Critics, and a growing list of newspaper websites. Bob is actively seeking syndication and writing assignments. |
Follow All American Investor on Twitter
No comments:
Post a Comment