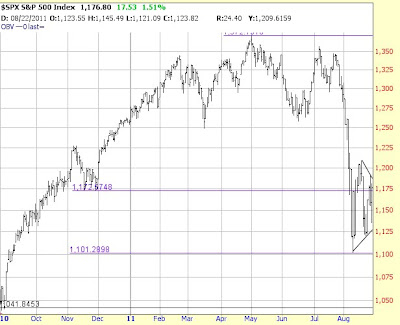
The Market Technical Monday Morning Chartology
You can see very clearly the trends of higher lows and lower highs. Technically speaking, the direction of a break tends to portend the direction of a new trend.

You can also see the clear break and recovery of GLD below the lower boundary of its short term up trend last Thursday. Usually, after a flush like GLD experienced last week, there is not an immediate snap back. If the current recovery continues then I will have been wrong again. However, if GLD undergoes a period of consolidation, then our Portfolios will likely re-purchase those share sold at higher prices.

The VIX maintains its volatility but at the upper zone of its current trading range--which is not good for stocks.

This Week’s Data
July personal income was reported up 0.3%, in line with expectations; July personal spending was up 0.8%, better than forecasts of up 0.5%; the PCE price index was up 0.2%, in line with estimates.
Other
The ECRI weekly leading index drops again--this is not a good sign (short):
C&I loans continue to expand, albeit at too slow a pace (short):
http://scottgrannis.blogspot.com/2011/08/bank-lending-continues-to-increase_26.html
No comments:
Post a Comment