The Market
Technical
What some of the measures of internal Market strength are showing (medium):
http://bit.ly/otYVia
Percentage of stocks above their 50 day moving average (charts):
http://www.bespokeinvest.com/thinkbig/2011/10/14/breadth-explodes-higher.html
Monday Morning Chartology
Last week the S&P took out two of the ‘lower highs’ from the previous short term down trend. It is now at the upper end of an August 2011 to present trading range. Clearly, the question now is, will it take out that trading range’s high (1230)? Despite stocks being undervalued, it makes no sense, technically speaking, to make any bets till we know the answer to that question.

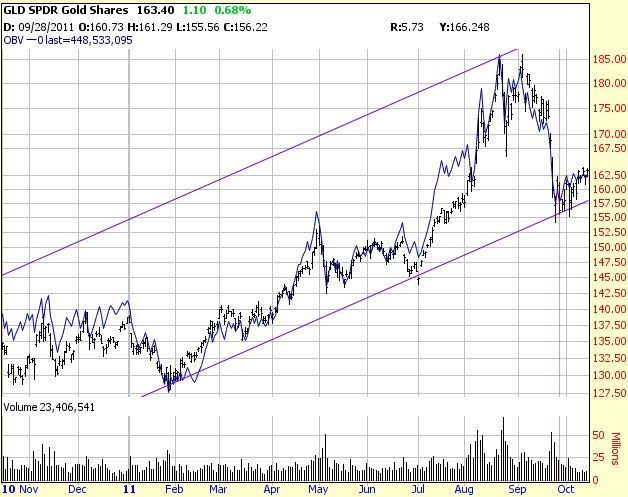
Much of the volatility has gone out of GLD, leaving it making slow, steady progress to the up side.
The VIX chart is extremely bullish, assuming the break down from the upper zone of its current trading range. It suggests that the S&P is going to take out 1230.

No comments:
Post a Comment