S&P 500 Index (E-Mini S&P 500 December 2011)

Trend sideways, slightly up. Near term support 1195 , Near term resistance 1292.
S&P 500 Fails Second Time to Stay Above 200-Day Average After Jumping 20%
All American Investor
CNBC Portfolio Challenge Bonus Bucks Answers for Thursday, November 10, 2011
Gold (Spot Comex)

Trend up, near term seasonal strength. Near term support 1650-1700 , Near term resistance 1800, 1900.
Gold Fields CEO Says China, India Demand to Prop Gold
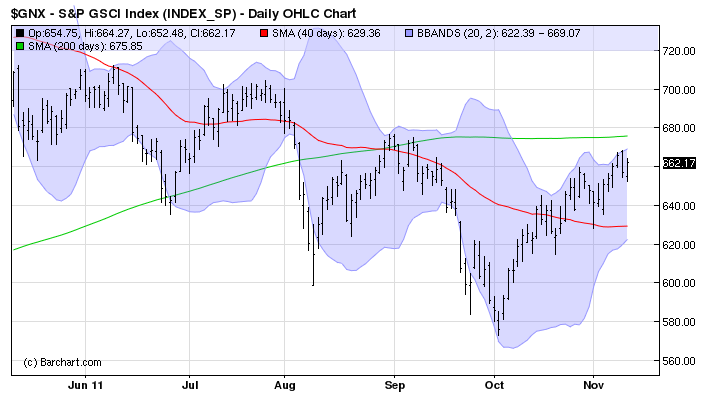
S&P GSCI (Inflation)
The S&P GSCI® is widely recognized as a leading measure of general price movements and inflation in the world economy. It provides investors with a reliable and publicly available benchmark for investment performance in the commodity markets, and is designed to be a “tradable” index. The index is calculated primarily on a world production-weighted basis and is comprised of the principal physical commodities that are the subject of active, liquid futures markets.
Cisco Systems (CSCO)

Short term trend UP. Long term trend, still sideways.
Cisco Up 4%: FYQ1 Easily Beats; Q2 Rev, EPS View Beats
Original content Bob DeMarco, All American Investor
No comments:
Post a Comment