The Goldman Sachs Commodity Index is soaring up. This is a good proxy of inflation and should be watched closely in the weeks and months ahead.
It should be noted that the GSCI is heavily weighted in oil. This is for good reason, oil is the single largest commodity in the world.
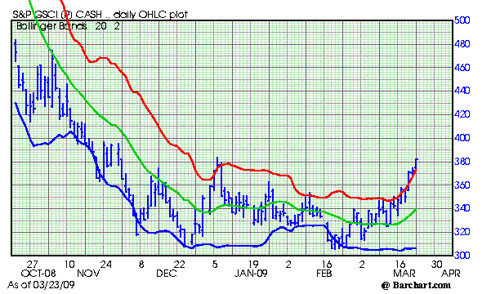
Two things to note in the chart:
- The GSCI is currently overbought as evidenced by the red line. Anytime a market trades above the red line it is overbought on a short term basis.
- The GSCI is coming into a major resistance--380-400.
The GSCI made its current low for the move last month at 305.85. The high occurred during July, 2008 at 893.85.
If you can't invest in commodity futures, you should be looking for stocks that benefit from inflation. Inflation type stocks should do very well in this environment.
Subscribe to All American Investor via Email
No comments:
Post a Comment