Showing posts with label analysis. Show all posts

Saturday, March 17, 2012

Energy Transfer Partners LP (ETP)


Energy Transfer Partners LP  (ETP)gathers, processes, stores and transports natural gas. mainly in Texas and surrounding states.

The partnership has grown profits and cash distributions between 10-15% over the past five years earning between 13-16% return of capital. ETP experienced difficulties in 2009-11 but should recover this year and continue to make progress as a result of:

(1) it is connected to almost every natural gas shale play in the US,

(2) acquisitions. It most recent is LDH Energy Asset Holdings,

(3) the recent sale of its propane will allow management to focus exclusively on its pipeline business.

Negatives:

(1) it is sensitive to fluctuations in commodity prices,

(2) volatility in the securities markets could make it harder to finance acquisitions,

(3) potentially unfavorable regulatory changes.

ETP is rated B++ by Value Line, has a debt to equity ratio of 60% and its stock yields 8.3%.

Tuesday, November 15, 2011

Microsoft (MSFT) 2011 Review


Microsoft (MSFT) is the world’s largest independent developer and seller of computer software products for a wide range of computing devices.

The company has earned between 30-40% return on equity over the last 10 years and has grown its earnings and dividends at a 12%+ pace over the last five years. MSFT was impacted by the recent economic down turn, but is returning to above average earnings growth as a result of:

(1) the introduction of Windows 7 is benefiting from its commanding position in the PC market,

(2) expansion into the mobile space,


Wednesday, September 01, 2010

Mastercard (MA) Notes and Chart


By Steve Cook
All American Investor

Mastercard (MA)is a global leader in electronic payments serving as a processor, franchisor and advisor to approximately 25,000 financial institutions for their credit, debit and other payment programs. In addition, it manages a family of payment card brands.

Tuesday, June 02, 2009

Gold | Fourth Time Up the Charm (Chart)


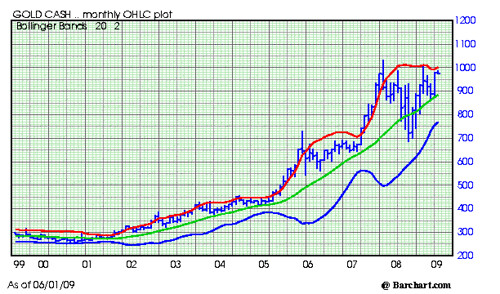
Gold, Cash, Monthly, Chart


There is a saying in technical trading that the fourth time up is the charm.

As you can see by looking at the Gold Chart, this is the fourth time up.

I am a little surprised by the rise in Gold at this time of year.
  • The more normal seasonal pattern is for Gold to peak in February - March.
  • After the seasonal peak, Gold normally trades down into the August - October period.
  • The strongest trading period for Gold normally occurs from October into March.
  • The seasonal pattern tells me that Gold is likely to take a rest.
  • On the other hand, the market looks very strong, technically, right now.
Previously, we mentioned the strong support in the 865-875 area. The market found willing buyers at that level and an interim low was made. We then mentioned that a close over the 927.50 area would likely send the market higher. This happened.

A close in Gold over 1,067.50 is likely to lead to an explosive up leg in gold. I am expecting this to happen, and the rise could very well be much higher than is currently being forecast by most.

I wrote previously about how I expect the buying of Gold out of Hong Kong to be enormous once the bull leg gets underway.

Back in the bull market of 1978 - 1980, Gold was often up sharply at the U.S. open based on large buying out of Hong Kong. Buying power from the China mainland should be a major factor in the price of gold in the year ahead. The buying is already picking up some momentum.

My experience tells me Gold is due for another correction back toward the 925 area -- the typical seasonal pattern. On the other hand, a break above this existing top could lead to a monster rally.

Long term gold traders should be patient and let it happen. Buyers of Gold stocks should see gains like they have rarely seen in the year ahead.
Subscribe to All American Investor via Email

Bob DeMarco is a citizen journalist and twenty year Wall Street veteran. Bob has written more than 500 articles with more than 11,000 links to his work on the Internet. Content from All American Investor has been syndicated on Reuters, the Wall Street Journal, Fox News, Pluck, Blog Critics, and a growing list of newspaper websites. Bob is actively seeking syndication and writing assignments.


More from All American Investor


Kindle: Amazon's Wireless Reading Device (Latest Generation)

Thursday, April 23, 2009

China Buying Copper (+ Chart)


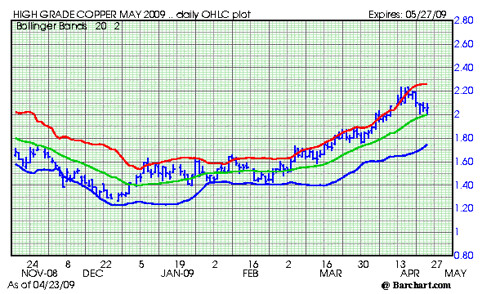
China is on a buying spree in copper. China State Reserves Bureau bought up 329,000 tonnes of copper in February and 375,000 tonnes in March. This explains in part the 70% surge in copper prices since the lows were made in December.

There is saying in copper -- buy on Thanksgiving, sell on Easter. Worked pretty good this year. Although, it was a little hair raising from Thanksgiving to the December low.

China has also been a big buyer of metals like aluminum, nickel, zinc, and tin.

Copper 423

Chart Notes:

  • Copper was overbought at the rally highs.
  • Copper traded above the red line (two standard deviations above the mean) and was due for a correction.
  • The market is currently testing the green line and 2.00.
  • The trend is up and the short, intermediate, and long term averages are all pointing up.
  • First support is around 2.00 and major support is in a band from 1.80 to 1.90.
  • Resistance is at the current highs around 2.23.
  • Technicals point to higher prices.
Subscribe to All American Investor via Email


Bob DeMarco is a citizen journalist and twenty year Wall Street veteran. Bob has written more than 500 articles with more than 11,000 links to his work on the Internet. Content from All American Investor has been syndicated on Reuters, the Wall Street Journal, Fox News, Pluck, Blog Critics, and a growing list of newspaper websites. Bob is actively seeking syndication and writing assignments.


More from All American Investor


Follow All American Investor on Twitter

Wednesday, April 22, 2009

PIMCOs Mohamed El-Erian on the Bank Stress Test


The article was written by PIMCO's Mohamed El-Erian.

The stress tests will accelerate the redefinition of the financial landscape, with a meaningful impact on future economic growth and welfare. However, whether the impact is for good or ill depends on how the results of the tests, and policies that flow from them, are pursued.
He makes the following key points:
  • The report must be transparent. He points out that the results will be examine by analyst all over the world. As a result, the methodology, assumptions, and analysis needs to clear and easily understood.
  • The results should be forward looking. The report should explain how the good banks get out from under the government. And, how bad banks that do not have access to private capital will be handled.
There can be little doubt that the release of the bank stress test information needs to be clear, concise, and understandable.

This is essential to create confidence in the market place. If the bull market in stocks is to continue, the report must create a sense of confidence. Anything less is likely to send the market back for a test of the lows we saw in early March.

This is a well written article that should be read and considered.

Bank tests we should get stressed about

Friday, April 17, 2009

Crude OIL What Next (Chart)


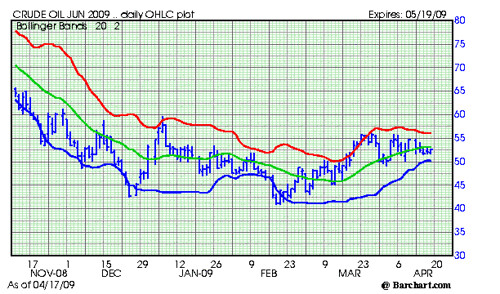
The trading range for crude oil continues to narrow. Support is now at $50 a barrel and resistance is around $56 basis the June futures contract.

The daily chart continues to show congestion and a breakout or breakdown is needed before a change in direction can be predicted.

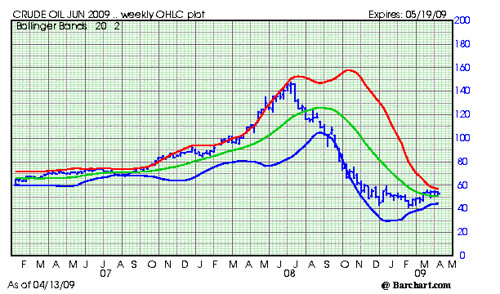
The monthly chart shows a similar pattern with a major congestion over the last 4 months. A breakout above 56 is likely to result in an almost immediate rise to $60 a barrel.

The recent surges in copper and soybeans lead me to believe that crude oil is heading higher soon. It will be worthwhile to watch if the seasonal demand for gasoline kicks in as weather improves.

June Crude Oil Monthly 417


Subscribe to All American Investor via Email


June Crude Oil Futures, Daily chart, Bands
Crude OIL Chart 417
Bob DeMarco is a citizen journalist and twenty year Wall Street veteran. Bob has written more than 500 articles with more than 11,000 links to his work on the Internet. Content from All American Investor has been syndicated on Reuters, the Wall Street Journal, Fox News, Pluck, Blog Critics, and a growing list of newspaper websites. Bob is actively seeking syndication and writing assignments.


More from All American Investor


Follow All American Investor on Twitter

Monday, April 13, 2009

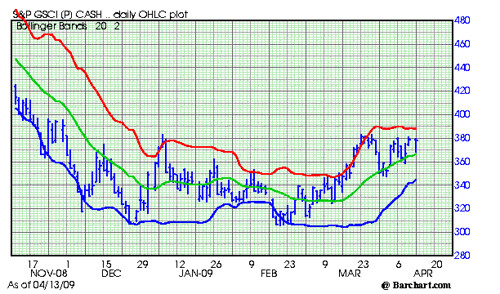
Goldman Commodity Index Ready to Blast Off (Chart)


Goldman Sachs Commodity Index (Cash)

Goldman Sachs Commodity Index

Notes:
  • The Goldman Sachs Commodity Index is heavily weighted in oil
  • The index is trying to claw its way above 380. This dates back to January.
  • The current formation is bullish.
  • Most times when a market continues to return to a area over and over, on the upside, it is an indication that the market wants to move in that direction.
  • Expect a break out to higher levels in short order.


Subscribe to All American Investor via Email


Bob DeMarco is a citizen journalist and twenty year Wall Street veteran. Bob has written more than 500 articles with more than 11,000 links to his work on the Internet. Content from All American Investor has been syndicated on Reuters, the Wall Street Journal, Fox News, Pluck, Blog Critics, and a growing list of newspaper websites. Bob is actively seeking syndication and writing assignments.


More from All American Investor


Follow All American Investor on Twitter

Thursday, April 09, 2009

Stocks the Nervous Norvis Market (Chart and View)


There are a lot of Nervous Norvises out there.

When the market moves down for a couple of days your typical Nervous Norvis bull gets sweaty palms and heart palpitations. A couple of days down and the bears are pounding their chest. The only thing the bears can think about is bad news. Left to wonder of course, why is the market going up with all this bad news--the world is coming to an end.

Stocks the Nervous Norvis Market

The Stock market is in a classic uptrend from the capitulation low.

Review:
At the moment:
  • The market continues to make higher lows. The most important ingredient of a trend.
  • The market found support on a dip three times. This indicates there are buyers below the market. This is necessary to raise confidence.
  • Bears continue to try and sell the market. The big difference they are running for cover at the first sign of strength.
  • The slope of the green line (midpoint, support) continues to point up and is strengthening.
  • The blue line is picking up momentum and as long as this continues it will help propel the market higher,
  • The market is once again approaching the red line (two standard deviations up) and this should be watched. Short term traders should resist the urge to buy the market when it is at, near, or above the red line. This is where nervous norvises really get killed.
  • There is still substantial resistance from 850-875. This is where the market will likely wear out bulls who lack patience. They will get out and will likely start chasing it right into the top and before the next major test of the downside.
Subscribe to All American Investor via Email


Bob DeMarco is a citizen journalist and twenty year Wall Street veteran. Bob has written more than 500 articles with more than 11,000 links to his work on the Internet. Content from All American Investor has been syndicated on Reuters, the Wall Street Journal, Fox News, Pluck, Blog Critics, and a growing list of newspaper websites. Bob is actively seeking syndication and writing assignments.


More from All American Investor


Follow All American Investor on Twitter

Sunday, April 05, 2009

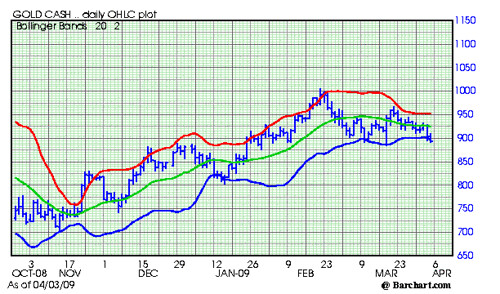
Gold Vulnerable on Technical and Seasonal Basis (Graph)


Gold is vulnerable seasonally and technically.

Gold Cash Chart 405


Notes:
  • Gold has a tendency to be weak on a seasonal basis at this time of year. Right now, both industrial and jewelry demand are weak. This pattern usually persists until summer.
  • Demand for gold is slow due to the weakness in the global economy.
  • Seasonal demand patterns in gold are sometimes offset by investor demand for physical gold and ETFs. This is happening right now.
  • Central banks continue to be large net sellers of Gold. Central banks have been net sellers of gold sales since 1999. Obviously, investor demand has been offsetting these large sales.
  • The above chart indicates that Gold is vulnerable to additional downside.
  • The market continues to trade back to the area right below 900. This is an indication that the Gold market wants to test lower levels.
  • If Gold holds these levels and trades above 1,000, an important new bull market would be starting.
  • Gold is likely to trade down an test the 865-875 area near term.
  • Longer term gold is likely to move higher and test the all time highs. Current odds, patterns, and seasonal factors favor this to occur in the second half of the year.
  • I am reminded of the saying--it is the job of the market to wear you out. Current trading in gold is causing lots of "angst" and the weak longs are likely to "puke" it up before we go higher.
Subscribe to All American Investor via Email
Bob DeMarco is a citizen journalist and twenty year Wall Street veteran. Bob has written more than 500 articles with more than 11,000 links to his work on the Internet. Content from All American Investor has been syndicated on Reuters, the Wall Street Journal, Fox News, Pluck, Blog Critics, and a growing list of newspaper websites. Bob is actively seeking syndication and writing assignments.


Follow All American Investor on Twitter

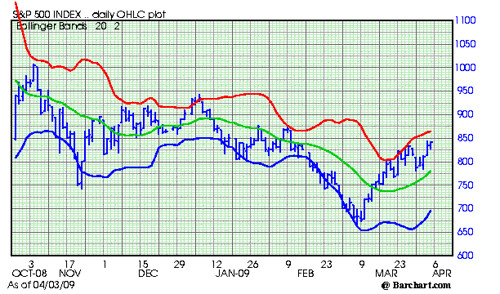
S & P 500 Up 24.53 Percent in 20 Days (Chart)


S and P 500 Chart
  • The S and P 500 has risen 24.53 percent in the last 20 trading days (close only).
  • The S and P closed at 842.50 on Friday.
  • There is substantial overhead resistance beginning at 850, all the way up to 875.
  • Resistance, as measured by the red line (two standard deviations, up) is around the 865 area and is flattening but still moving up.
  • Hard support is now well below the market around the 780 area. The slope of the green line (mid point of the range) continues to slope up. This is a positive.

S and P 500 Daily Chart 405
Subscribe to All American Investor via Email


Bob DeMarco is a citizen journalist and twenty year Wall Street veteran. Bob has written more than 500 articles with more than 11,000 links to his work on the Internet. Content from All American Investor has been syndicated on Reuters, the Wall Street Journal, Fox News, Pluck, Blog Critics, and a growing list of newspaper websites. Bob is actively seeking syndication and writing assignments.

Follow All American Investor on Twitter

More from All American Investor


Monday, March 30, 2009

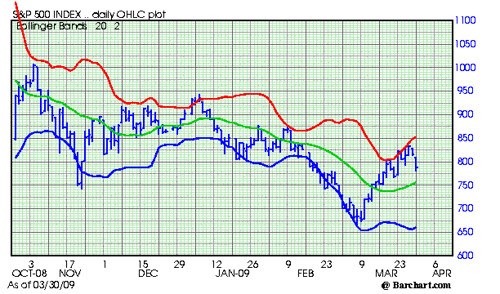
S & P 500 Correction or Rejection?


S & P 500 Chart, Daily Bar, March 30

S & P 500, Chart 3302
What to watch:
  • Half way back price is 833. This is an important technical retracement point.
  • The green line (the midpoint) is 756 and rising. Tomorrow it should be around the 764 area. The market should find good support at the line.
  • The first major support area is 740-752. From previous up and down moves.
  • The small gap from the opening is troublesome, and needs to be closed.
The S & P 500 is at a major turning point. I wrote earlier about the importance of establishing support below the market. This test of support is happening now. If the uptrend is good, this support will hold and the market will return to the upside resistance in the 825 area. If the market falls below 740 a test of the lows would be indicated.

It is always easier to be bullish once the market starts to establish support. This lets you know that there are willing buyers on in waiting.

I still favor the upside. But, it really is a coin toss right now.

Subscribe to All American Investor via Email

Bob DeMarco is a citizen journalist and twenty year Wall Street veteran. Bob has written more than 500 articles with more than 11,000 links to his work on the Internet. Content from All American Investor has been syndicated on Reuters, the Wall Street Journal, Fox News, Pluck, Blog Critics, and a growing list of newspaper websites. Bob is actively seeking syndication and writing assignments.

Follow All American Investor on Twitter

More from All American Investor


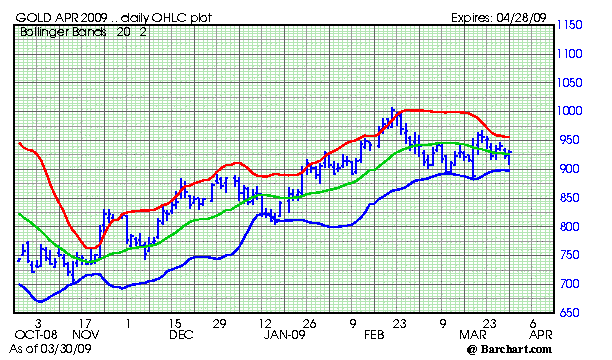
Gold Pops Twenty Bucks, What next? (Chart)


Gold Futures, Daily Chart.

Also see:

GoldCorp (GG) Twelve Times Your Money in Ten Years (Chart)


April Gold 330


Gold futures popped $20 off its lows this morning after stocks opened.

A look at the chart shows that price ranges are narrowing. Something is going to give soon.

From a seasonal demand perspective, the slowest period of demand for gold every year is from Spring into Summer (jewelry, industrial demand). Gold has a tendency to trend down during this period. If gold is going up from here it will take good investor demand for the physical. Demand could come from purchases by the gold exchange traded fund--GLD.

Gold made a monster run at the the end of 2008 into February 2009. The market has been moving sideways from the top.

The market continues to languish which is not a bad sign given the weak seasonal. This market should be watching closely as a breakout of this range is coming soon. The broader trend is still up.
Subscribe to All American Investor via Email
Follow All American Investor on Twitter

Is Lorillard (LO) in Play?


Is Lorillard (LO) in play? This is an interesting story. From Barron's,
Lorillard's fans in the investment community say that the company is underappreciated on Wall Street -- partly because of its involvement in tobacco -- and that it is the most attractive takeover target in the consolidating global cigarette industry. There lately has been talk that Reynolds, maker of the Camel, Winston and Kool brands, might buy Lorillard for a sizable premium above the recent share price of $61. Reynolds and Lorillard declined to comment.

Deal or no deal, Lorillard looks appealing. Its shares trade at 11 times projected 2009 profit of $5.50 a share and provide a yield of 6%. Lorillard pays out 70% to 75% of its profit in dividends. The company, which was spun off by Loews (L) last year, has a great balance sheet, with more than $1 billion of cash at year end and no debt.
The dividend also gets my attention.
Subscribe to All American Investor via Email
Read the Article

Will Lorillard Meet Its Match?


Lorillard

Bob DeMarco is a citizen journalist and twenty year Wall Street veteran. Bob has written more than 500 articles with more than 11,000 links to his work on the Internet. Content from All American Investor has been syndicated on Reuters, the Wall Street Journal, Fox News, Pluck, Blog Critics, and a growing list of newspaper websites. Bob is actively seeking syndication and writing assignments.

Follow All American Investor on Twitter
More from All American Investor


Friday, March 27, 2009

Vehicle Sales Plunge--Ugly Chart


Subscribe to All American Investor via Email

Personal Income and Expenditures (Numbers and Charts)


Personal Consumption Expenditures tick up. A positive factor for first Quarter GDP.


Personal income
  • decreased $29.1 billion, or 0.2 percent
  • disposable personal income (DPI) decreased $10.5 billion, or 0.1 percent

Personal consumption expenditures (PCE)
  • increased $17.2 billion, or 0.2 percent. In January, personal
  • income increased $20.5 billion, or 0.2 percent
  • DPI increased $164.6 billion, or 1.6 percent
  • PCE increased $94.8 billion, or 1.0 percent, based on revised estimates.
Real disposable income
  • decreased 0.4 percent in February, in contrast to an increase of 1.3 percent in January.
Real PCE
  • decreased 0.2 percent, in contrast to an increase of 0.7 percent.
  • The price index for PCE increased 0.3 percent, the same increase as in January.

Source: Bureau of Economic Analysis (more details and pres release)

Subscribe to All American Investor via Email

Disposable Personal Income ticks up.


Bob DeMarco is a citizen journalist and twenty year Wall Street veteran. Bob has written more than 500 articles with more than 11,000 links to his work on the Internet. Content from All American Investor has been syndicated on Reuters, the Wall Street Journal, Fox News, Pluck, Blog Critics, and a growing list of newspaper websites. Bob is actively seeking syndication and writing assignments.


Follow All American Investor on Twitter


Thursday, March 26, 2009

S and P 500 Looks good as forecast be careful now (Chart)


S and P 500 March 26 Close
S and P 500 Chart 3262


On March 7, we showed the Monthly Chart of the S and P 500 and wrote,
You can see the slope of the market is very severe. This cannot be sustained much longer. When a market index trades down at a sharp angle like the one above, the market always rallies sharply when it reverses directions. This rally could start at any time.
The Market closed at 676.53 on March 6, and the big rally started the next day. On March 22 we wrote, Stocks Don't Fight the Tape, and the market blasted off the next day.

The market looks very good and continues to hug the red line on the way up (two standard deviations above the line). However, any sharp rally tomorrow will be met with stiff resistance. We will update the numbers in the morning.

Also, a note of cautions. The slope of the uptrend is getting too severe and the market will be subject to a sharp correction if this continues.

Subscribe to All American Investor via Email


Bob DeMarco is a citizen journalist and twenty year Wall Street veteran. Bob has written more than 500 articles with more than 11,000 links to his work on the Internet. Content from All American Investor has been syndicated on Reuters, the Wall Street Journal, Fox News, Pluck, Blog Critics, and a growing list of newspaper websites. Bob is actively seeking syndication and writing assignments.

Follow All American Investor on Twitter
More from All American Investor


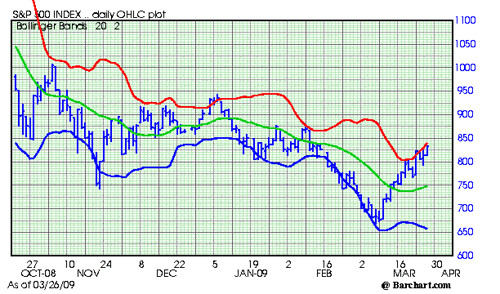
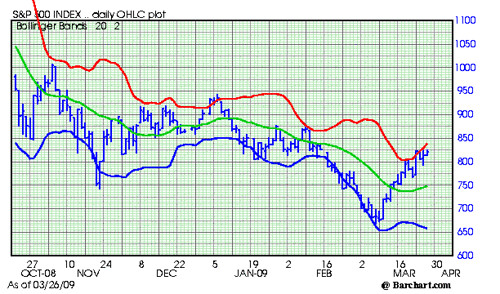
S and P Chart Healthy and Congested


S and P 500 Cash, Chart, March 26.

S an P 500 Chart 326


This S and P chart continues to show that technical resilience is building. The S and P is still in a range expansion and this indicates that volatility could pick up at any time. The red line (plus two standard deviations) is sloping up and the market is continuing to hug the line. All short term positives.

The other day we mentioned that there was considerable resistance and congestion in the 825 area. The market continues trying to attack this area. There is more upside potential on a short term basis then we had a few days ago, now up to the 850 area. Good support is down around 750 and is rising.

Bulls should be a bit cautious right now. If the market can't get firmly through 825 soon, the market might be ripe for a further test of the downside to establish support.

Short term still looks good to me.


Subscribe to All American Investor via Email


Bob DeMarco is a citizen journalist and twenty year Wall Street veteran. Bob has written more than 500 articles with more than 11,000 links to his work on the Internet. Content from All American Investor has been syndicated on Reuters, the Wall Street Journal, Fox News, Pluck, Blog Critics, and a growing list of newspaper websites. Bob is actively seeking syndication and writing assignments.

Follow All American Investor on Twitter
More from All American Investor


Wednesday, March 25, 2009

They called me crazy, S and P 900-1000


On Sunday, I wrote an article on this blog entitled, Stocks Don't Fight the Tape.

In the article I wrote the following,
My guess is that we are going to have one monster rally shortly. I could envision the market on the S and P 500 soaring up to 900 or 1000. That would qualify as one heck of a rally.
When I wrote that article the S and P 500 was at 768.54.

On the open yesterday, I pointed out that the S and P 500 chart indicated the market was overbought. The S and P was hitting its red line (two standard deviations above the mean). The statistical odds always favor a pullback when that happens. The other point I was making, was that, the market now has some good technical resilience. This is a necessary component before a market can get into a healthy uptrend.

Just so you won't think I am some kind of all the time bulldog, you can go read an article I wrote on this blog when I was nutsy bearish back in September--Financial Meltdown--Where there is Smoke, there is Fire. I concluded that article by saying, "cash was king". At the time, the S and P 500 was well above 1200.

This investment blog is relatively new. I am seeking more subscribers (free). If you think this is worthwhile please subscribe. And then, tell your friends. Thanks.

The purpose here is to keep you thinking and help you make good decisions. On occasion you will find some gems like, Don't Fight the Tape.
Subscribe to All American Investor via Email
Bob DeMarco is a citizen journalist and twenty year Wall Street veteran. Bob has written more than 500 articles with more than 11,000 links to his work on the Internet. Content from All American Investor has been syndicated on Reuters, the Wall Street Journal, Fox News, Pluck, Blog Critics, and a growing list of newspaper websites. Bob is actively seeking syndication and writing assignments.

Tuesday, March 24, 2009

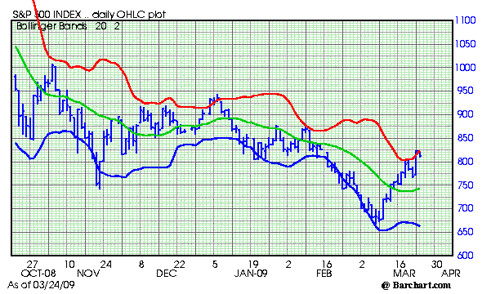
S and P 500 Attacking the Red LIne (Chart)


The rally in the S and P 500 the last two weeks has been nothing short of spectacular.

S and P 500 Chart 324


If you take a good look at the chart you will notice that the S and P bounced off the red line on March 18, 19. The red line should be considered resistance, and trades over that line are often met with resistance. The red line is the two standard deviation barrier.

Once again, we are bouncing off the line. So today looks like a day of rest. The red line is now sloping up fast, and short term we are in a range expansion. The market will have additional upside potential in the days ahead. However, if you look across the chart, all the way back to October, you will notice there is a lot of congestion in the 825 area.

Sooner or later, the market will back up and test some lower resistance. This is when the market will prove itself or fail. I understand that people are anxious to get their money back. However, since the bottom occurred, the market has not had a correction or any serious test of prices on the down side.

To become a comfortable bull, it is necessary to see the market probe lower levels and hold. Once good support areas can be identified, it is much easier for traders to add support to the market by buying againsst those support levels.

It is too early to tell if this is a correction in a bear market, or the turn in the market. The market still needs to prove on drops that there are buyers in waiting.

It is a good time to be patient. The market does look good on a short term basis right now.
Subscribe to All American Investor via Email


Bob DeMarco is a citizen journalist and twenty year Wall Street veteran. Bob has written more than 500 articles with more than 11,000 links to his work on the Internet. Content from All American Investor has been syndicated on Reuters, the Wall Street Journal, Fox News, Pluck, Blog Critics, and a growing list of newspaper websites. Bob is actively seeking syndication and writing assignments.


Follow All American Investor on Twitter