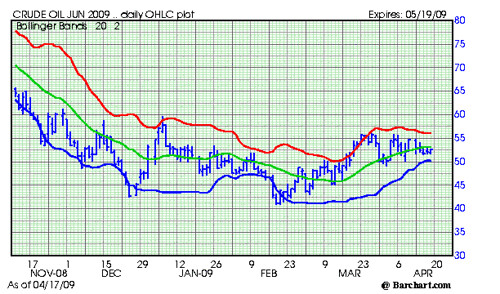
The daily chart continues to show congestion and a breakout or breakdown is needed before a change in direction can be predicted.
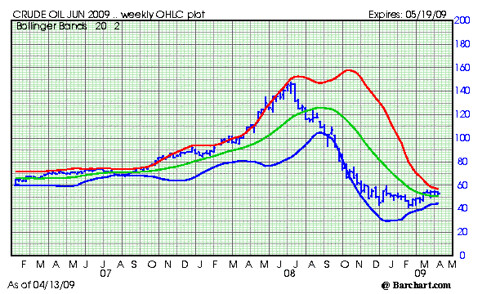
The monthly chart shows a similar pattern with a major congestion over the last 4 months. A breakout above 56 is likely to result in an almost immediate rise to $60 a barrel.
The recent surges in copper and soybeans lead me to believe that crude oil is heading higher soon. It will be worthwhile to watch if the seasonal demand for gasoline kicks in as weather improves.
Subscribe to All American Investor via Email
June Crude Oil Futures, Daily chart, Bands
 Bob DeMarco is a citizen journalist and twenty year Wall Street veteran. Bob has written more than 500 articles with more than 11,000 links to his work on the Internet. Content from All American Investor has been syndicated on Reuters, the Wall Street Journal, Fox News, Pluck, Blog Critics, and a growing list of newspaper websites. Bob is actively seeking syndication and writing assignments. Bob DeMarco is a citizen journalist and twenty year Wall Street veteran. Bob has written more than 500 articles with more than 11,000 links to his work on the Internet. Content from All American Investor has been syndicated on Reuters, the Wall Street Journal, Fox News, Pluck, Blog Critics, and a growing list of newspaper websites. Bob is actively seeking syndication and writing assignments. |
More from All American Investor
- 30 Year Conventional Mortgage Rate (Chart)
- Top Hedge Fund Managers Make Billions in 2008
- Systemic Risk Defined--Too Big to Fail
- Ray Dalio on the current state of affairs in the market
- Roubini Predicts U.S. Losses May Reach $3.6 Trillion
- Option ARM--The Toxic Mortgage
- Warren Buffett's Annual Letter to Investors (Cliff Notes Version)

Follow All American Investor on Twitter
No comments:
Post a Comment