Showing posts with label supply. Show all posts

Thursday, August 26, 2010

New Gold Demand Trends, Supply, and Demand Statistics Q2 2010


By Bob DeMarco
All American Investor

Demand statistics for Q2 2010
  • Total gold demand in Q2 2010 rose by 36% to 1,050 tonnes, largely reflecting strong gold investment demand compared to the second quarter of 2009. In US$ value terms, demand increased 77% to $40.4 billion.
  • Investment demand was the strongest performing segment during the second quarter, posting a rise of 118% to 534.4 tonnes compared with 245.4 tonnes in Q2 2009.

Friday, November 13, 2009

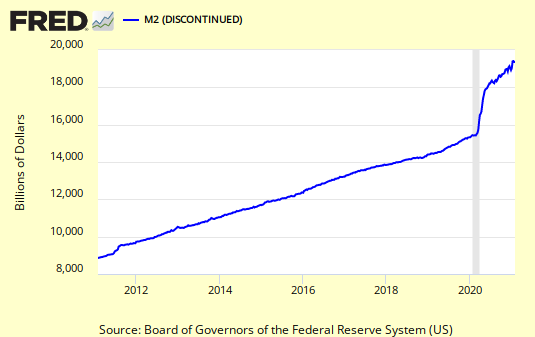
M2, Money Supply 11-13 (Graph)


Ready to go off the chart. I'll get some bigger chart paper.


M2 includes a broader set of financial assets held principally by households. M2 consists of M1 plus:

(1) savings deposits (which include money market deposit accounts, or MMDAs);
(2) small-denomination time deposits (time deposits in amounts of less than $100,000); (3) balances in retail money market mutual funds (MMMFs).

Seasonally adjusted M2 is computed by summing savings deposits, small-denomination time deposits, and retail MMMFs, each seasonally adjusted separately, and adding this result to seasonally adjusted M1.
Subscribe to All American Investor via Email


Kindle: Amazon's 6" Wireless Reading Device


Original content Bob DeMarco, All American Investor

Friday, July 17, 2009

M2, Money Supply Showing Signs of a Peak (Graph)


Subscribe to All American Investor via Email

M2


Bob DeMarco is a citizen journalist and twenty year Wall Street veteran. Bob has written more than 700 articles with more than 18,000 links to his work on the Internet. Content from All American Investor has been syndicated on Reuters, the Wall Street Journal, Fox News, Pluck, Blog Critics, and a growing list of newspaper websites. Bob is actively seeking syndication and writing assignments.


Kindle: Amazon's 6" Wireless Reading Device

Friday, June 19, 2009

Money Supply Climbs to New High (M2, Graph)


Subscribe to All American Investor via Email


Bob DeMarco is a citizen journalist and twenty year Wall Street veteran. Bob has written more than 700 articles with more than 18,000 links to his work on the Internet. Content from All American Investor has been syndicated on Reuters, the Wall Street Journal, Fox News, Pluck, Blog Critics, and a growing list of newspaper websites. Bob is actively seeking syndication and writing assignments.


More from All American Investor


Follow All American Investor on Twitter

Saturday, June 13, 2009

Money Supply Steady Climb Continues (M2, Graph)


Sooner or later the FEDs resolve on keeping inflation low is going to be tested. If the market place senses that the FED has lost its resolve as "inflation cops" interest rates are likely to soar.

M2 includes a broader set of financial assets held principally by households. M2 consists of M1 plus: (1) savings deposits (which include money market deposit accounts, or MMDAs); (2) small-denomination time deposits (time deposits in amounts of less than $100,000); and (3) balances in retail money market mutual funds (MMMFs). Seasonally adjusted M2 is computed by summing savings deposits, small-denomination time deposits, and retail MMMFs, each seasonally adjusted separately, and adding this result to seasonally adjusted M1.
Subscribe to All American Investor via Email

Bob DeMarco is a citizen journalist and twenty year Wall Street veteran. Bob has written more than 500 articles with more than 11,000 links to his work on the Internet. Content from All American Investor has been syndicated on Reuters, the Wall Street Journal, Fox News, Pluck, Blog Critics, and a growing list of newspaper websites. Bob is actively seeking syndication and writing assignments.


More from All American Investor

Kindle: Amazon's 6" Wireless Reading Device


Follow All American Investor on Twitter

Saturday, June 06, 2009

M2 Continues to Soar (Graph)


M2 soared to a new all time high $8,358.2 billions.

Gold rising, commodities rising, long term interest rates rising, no surprise.

H.6 -- M2 includes a broader set of financial assets held principally by households. M2 consists of M1 plus: (1) savings deposits (which include money market deposit accounts, or MMDAs); (2) small-denomination time deposits (time deposits in amounts of less than $100,000); and (3) balances in retail money market mutual funds (MMMFs). Seasonally adjusted M2 is computed by summing savings deposits, small-denomination time deposits, and retail MMMFs, each seasonally adjusted separately, and adding this result to seasonally adjusted M1.

Kindle: Amazon's 6" Wireless Reading Device

Saturday, May 23, 2009

Fed Series M2, Money Supply Still Soaring (Chart)


Fed Data, M2, Money Stock, Chart


We wrote several months ago about how it takes 12-18 months for increases in money supply to effect interest rates and commodity prices. We are now in this window.

The dramatic increases in money supply, the Fed balance sheet, and the drop in the dollar are starting to weigh on investor confidence.

Stocks rarely rise when confidence dwindles. It now seems we are moving from what was growing confidence in the markets to growing uncertainty.

The risk of owning equities on a short term basis not outweighs the reward. The threat of rising interest rates has also risen dramatically. This weeks surge in Gold is another barometer of investor confidence.
Subscribe to All American Investor via Email

Bob DeMarco is a citizen journalist and twenty year Wall Street veteran. Bob has written more than 500 articles with more than 11,000 links to his work on the Internet. Content from All American Investor has been syndicated on Reuters, the Wall Street Journal, Fox News, Pluck, Blog Critics, and a growing list of newspaper websites. Bob is actively seeking syndication and writing assignments.Bob DeMarco, All American Investor, May 2009

Kindle: Amazon's Wireless Reading Device (Latest Generation)


Follow All American Investor on Twitter

Tuesday, May 12, 2009

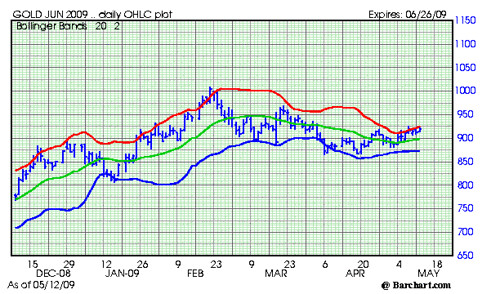
Is Gold Ready to Glitter? (Outlook, Chart)


June Gold, Bar, Chart


Gold has a tendency to be seasonally week from March through August. As a result, it is always risky to speculate in gold during this time frame.

In April, we wrote that gold was likely to test the 865 - 875 area. This happened, the market held, and made a very nice double bottom. This is now an area of major support.

Right now gold is running into resistance in the 827 area.

Any close over 827.50 would indicate that gold is ready to move higher.
Subscribe to All American Investor via Email
The market place is now starting to focus on the potential inflationary impact of the policies being carried out by the Federal Reserve and Treasury. The money supply, Fed balance sheet, and reserve balances are all soaring. The Treasury is buying mortgage backed securities and treasuries in an attempt to keep interest rates artificially low.

This is a big positive for gold. The marketplace is beginning to sense that a major increase in inflation is on the horizon. Gold is likely to discount this phenomena well in advance.

Gold, like all commodities, goes up when demand increases and supplies get tight. Both are happening right now.

What to watch:
  • Purchases of gold by the SPDR Gold Shares -- GLD. The ETF is now the sixth largest holder of gold in the world. When demand for the shares increase their purchases of physical gold increase.
  • Demand out of China. This includes buys by the Central Bank and demand for jewelry. Sooner or later demand from China is going to be explosive. While it is not well known, during the last big bull market in gold, much of the upside was fueled by purchases out of Hong Kong.
  • Any close over 827.50 basis June Gold.

Background:
  • Gold has a tendency to be weak on a seasonal basis at this time of year. This pattern usually persists until summer.
  • Industrial and jewelry demand for gold has been slow due to the weakness in the global economy.
  • The market experienced some jitters on a rumor of IMF gold sales. This is not happening.
  • The market also sold off on news out of India that demand for gold was dropping.
  • Seasonal demand patterns in gold are sometimes offset by investor demand for physical gold and ETFs.
  • Central banks continue to be large net sellers of Gold. Central banks have been net sellers of gold sales since 1999. Obviously, investor demand has been offsetting these large sales.

Here is some history on gold since 1980.
  • Gold rallied from $135 an ounce in 1978 to $860 an ounce in 1980.
  • The late 70s-80s gold rush was caused by consumer fears about inflation. The monthly CPI reading reached 1.5 percent in 1980. Gold peaked along with the inflation rate.
  • From 1980 until late 1999 gold prices trended down.
  • Gold bottomed near $250 an ounce in 1999.
  • When gold was making its lows in 1999, most of the major Central Banks around the world announced they intended to sell-off a large fraction of their gold reserves (400 tonnes a year, 2000 tonnes total).
  • Central banks are still selling their gold reserves in 2009 (500 tonnes a year, 2500 tonnes total).
  • Central banks continue to sell gold and the price continues to rise.
  • Since the late 1980s the purchases of gold by institutional investors has been rising. This trend continues and seems to be picking up momentum.
  • Demand for gold rose sharply in the fourth quarter of 2008, up 27 percent to $26.7 billion (year over year, Q4-2007 versus Q4- 2008).


    Bob DeMarco is a citizen journalist and twenty year Wall Street veteran. Bob has written more than 500 articles with more than 11,000 links to his work on the Internet. Content from All American Investor has been syndicated on Reuters, the Wall Street Journal, Fox News, Pluck, Blog Critics, and a growing list of newspaper websites. Bob is actively seeking syndication and writing assignments.


    Follow All American Investor on Twitter

Friday, April 17, 2009

Crude OIL What Next (Chart)


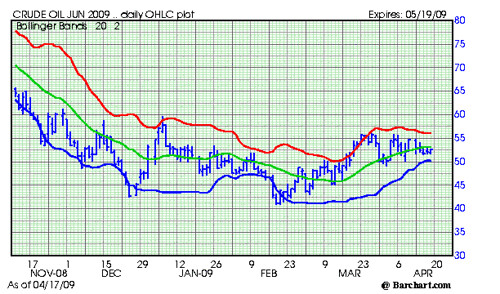
The trading range for crude oil continues to narrow. Support is now at $50 a barrel and resistance is around $56 basis the June futures contract.

The daily chart continues to show congestion and a breakout or breakdown is needed before a change in direction can be predicted.

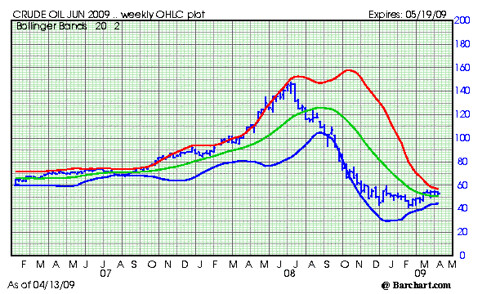
The monthly chart shows a similar pattern with a major congestion over the last 4 months. A breakout above 56 is likely to result in an almost immediate rise to $60 a barrel.

The recent surges in copper and soybeans lead me to believe that crude oil is heading higher soon. It will be worthwhile to watch if the seasonal demand for gasoline kicks in as weather improves.

June Crude Oil Monthly 417


Subscribe to All American Investor via Email


June Crude Oil Futures, Daily chart, Bands
Crude OIL Chart 417
Bob DeMarco is a citizen journalist and twenty year Wall Street veteran. Bob has written more than 500 articles with more than 11,000 links to his work on the Internet. Content from All American Investor has been syndicated on Reuters, the Wall Street Journal, Fox News, Pluck, Blog Critics, and a growing list of newspaper websites. Bob is actively seeking syndication and writing assignments.


More from All American Investor


Follow All American Investor on Twitter

Tuesday, April 14, 2009

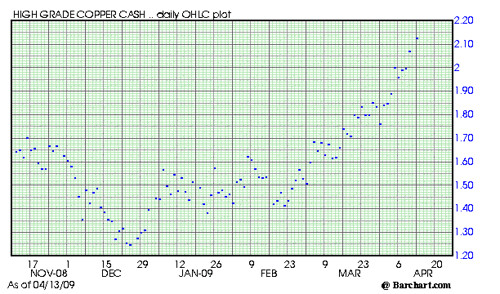
Copper Soaring, China Buying (Chart)


Cash Copper, Daily Price Mark

Cash Copper Chart 414

The chart contains a single price (dot) for each trading day.

Notes:
  • The price of copper is moving up fast. This is being caused by buying out of China.
  • China is a large importer of cooper. They import about 85 percent of their need.
  • On December 24, copper traded at the low price of 124.75.
  • Today the price was marked at 212.55.
  • The price of copper has risen 70 percent in the last 4 months.
You should be looking at Freeport McMoran (FCX).  Freeport benefits from rises in the price of copper. The company is also a large producer of gold. We will cover Freeport McMoran tommorow.

You should note the effect that demand from China can have  on commodity prices. One theme that should become evident is that when China starts to demand the supply of a commodity its price is likely to rise dramatically. This will create lots of opportunites for smart investors.

There are several ways to take advantage of thirsty demand for commodities from China. These include: sector stocks, ETFs, options, and commodity futures contracts.

We will be honing in on these opportunities in the days and weeks ahead.

So stay tuned daily.
Subscribe to All American Investor via Email

Bob DeMarco is a citizen journalist and twenty year Wall Street veteran. Bob has written more than 500 articles with more than 11,000 links to his work on the Internet. Content from All American Investor has been syndicated on Reuters, the Wall Street Journal, Fox News, Pluck, Blog Critics, and a growing list of newspaper websites. Bob is actively seeking syndication and writing assignments.


Follow All American Investor on Twitter

Sunday, April 05, 2009

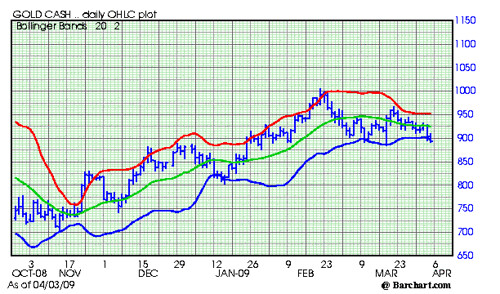
Gold Vulnerable on Technical and Seasonal Basis (Graph)


Gold is vulnerable seasonally and technically.

Gold Cash Chart 405


Notes:
  • Gold has a tendency to be weak on a seasonal basis at this time of year. Right now, both industrial and jewelry demand are weak. This pattern usually persists until summer.
  • Demand for gold is slow due to the weakness in the global economy.
  • Seasonal demand patterns in gold are sometimes offset by investor demand for physical gold and ETFs. This is happening right now.
  • Central banks continue to be large net sellers of Gold. Central banks have been net sellers of gold sales since 1999. Obviously, investor demand has been offsetting these large sales.
  • The above chart indicates that Gold is vulnerable to additional downside.
  • The market continues to trade back to the area right below 900. This is an indication that the Gold market wants to test lower levels.
  • If Gold holds these levels and trades above 1,000, an important new bull market would be starting.
  • Gold is likely to trade down an test the 865-875 area near term.
  • Longer term gold is likely to move higher and test the all time highs. Current odds, patterns, and seasonal factors favor this to occur in the second half of the year.
  • I am reminded of the saying--it is the job of the market to wear you out. Current trading in gold is causing lots of "angst" and the weak longs are likely to "puke" it up before we go higher.
Subscribe to All American Investor via Email
Bob DeMarco is a citizen journalist and twenty year Wall Street veteran. Bob has written more than 500 articles with more than 11,000 links to his work on the Internet. Content from All American Investor has been syndicated on Reuters, the Wall Street Journal, Fox News, Pluck, Blog Critics, and a growing list of newspaper websites. Bob is actively seeking syndication and writing assignments.


Follow All American Investor on Twitter

Tuesday, March 24, 2009

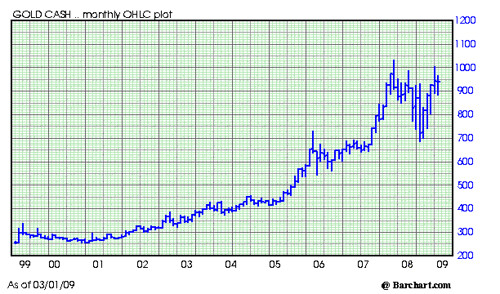
Gold Ten Year Chart and Highlights


Cash Gold Monthly Chart 324

This is the cash chart for Gold. Each Bar equals one month. Time frame, 1999-2009.

Some Gold Chart facts:
  • The low in Gold was made during March, 2001 around the 255.00 level.
  • The high in Gold was made during March, 2008 around the 1,032.00 level.
  • Every year from 2001 to 2008, Gold made a new high for the move.
  • Gold plunged for most of 2008 and made its low during October, 2008 around the 682.00 level.
  • Gold touched 1,000 for the second time February, 2009.
  • Seasonal demand for Gold is low during the Spring months.
  • Seasonal demand for Gold is usually very strong in the second half of the year.
We will be issuing a new report soon on the seasonal tendencies for gold. We will also discuss specific supply/demand factors that effect the price of gold.

If you are interested in receiving more information on Gold from All American Investor you can subscribe free via email, RSS, or Twitter.
Subscribe to All American Investor via Email

Saturday, March 21, 2009

Money Supply continues to Soar (Chart)


Money Suppy320

M2, Money Stock continues to soar and accelerate. Chart current through March 20.
Subscribe to All American Investor via Email

Thursday, March 19, 2009

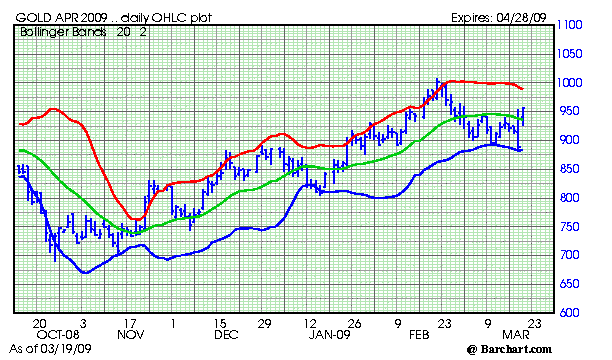
Gold Shock and Awe (Chart)


April Gold 2009
April Gold futures closed yesterday at 889.10 with a low of 882.70. Today it is trading in the 950 area. Clearly a major reaction to yesterday's news from the Federal Reserve Board. An impressive rally so far. Most gold stocks are up 5 percent or more today.

If you have been following along on this blog, you know I believe that gold is going higher--a lot higher. As a note of caution right now, gold has a very strong seasonal pattern, and we are entering the weakest part of the year. Gold has a tendency to peak in the February-March period and then bottom in the August-October period. I point this out so you know there is some downside risk at this time of year. If you own gold you need to be patient at this time of year.
If you look at the chart above you will notice that gold bottomed on October 24, 2008 at 734.60. This was down from over a 1000 in March of 2008.
The strong seasonal patterns in gold are due to buying patterns. Buying for jewelery, and buying out of China and India tend to be strong late in the year (I will explain this in a separate article soon).

There are three types of buying for gold: jewelry, industrial buying, and investment buying. In the last year, the jewelry component was down about 6 percent. Demand from investors rose more than 182 percent. In the fourth quarter when gold was rallying strongly demand was greater than supply (up 26 percent over the same quarter in 2007). I expect to see good buying out of China in the years ahead. I suspect the Central Bank of China will continue to add gold as a reserve. I also expect strong buying from investors. If the world economy picks up you can expect jewelry buying to increase. Inflation fears are likely to grow as the Federal Reserves continues to grow the monetary base through a never ending series of anti-deflation measures.

The above chart shows that gold continues to make higher highs and higher lows. The exception being yesterday when the market spiked down and right back up late yesterday and today.

On March 5, 2009, I wrote about Yamana Gold (AUY, $8.50). It is a good idea to look at Yamana. Other good ideas are: GLD (the ETF), GG (Goldcorp), FCX (Freeport-McMoRan Copper & Gold), ABX (Barrick Gold) and a long list of other gold stocks.

I will be writing more about gold, the fundamentals, supply and demand, seasonal trends, and gold stocks in the days ahead.
Subscribe to All American Investor via Email

Bob DeMarco is a citizen journalist and twenty year Wall Street veteran. Bob has written more than 500 articles with more than 11,000 links to his work on the Internet. Content from All American Investor has been syndicated on Reuters, the Wall Street Journal, Fox News, Pluck, Blog Critics, and a growing list of newspaper websites. Bob is actively seeking syndication and writing assignments.

Follow All American Investor on Twitter

Sunday, March 01, 2009

Why gold is going up (Part one)


This is the first article in a series of articles on gold. This article will give you some perspective on the historical price of gold and the reason why gold is going up now. In future articles, I will discuss the current supply/demand statistics for gold, the best ways to purchase gold, why the Chinese and Indians are buying gold, and my forecast for gold well above $2000 an ounce (Hint: think oil).

London Gold Fix (PM), Quoted in Dollars

blog it

Subscribe to All American Investor via Email
Follow us on Twitter

Larry Kudlow acts like gold near $1000 is a new thing. If Larry had been paying attention he would have noticed that gold traded at $1000 per troy ounce back in March, 2008. After that peak in gold, the price of gold proceeded to crash down to the $700 level in November, 2008. Gold is now moving up sharply again and it seems that this is disconcerting to Larry. Perhaps he should look at the current supply/demand statistics and the growing number of institutional investors that see gold as a good alternative investment in their portfolios.

Here is some background and history on gold since 1980.
  • Gold rallied from $135 an ounce in 1978 to $860 an ounce in 1980.
  • The late 70s-80s gold rush was caused by consumer fears about inflation. The monthly CPI reading reached 1.5 percent in 1980. Gold peaked along with the inflation rate.
  • From 1980 until late 1999 gold prices trended down.
  • Gold bottomed near $250 an ounce in 1999.
  • When gold was making its lows in 1999, most of the major Central Banks around the world announced they intended to sell-off a large fraction of their gold reserves (400 tonnes a year, 2000 tonnes total).
  • Central banks are still selling their gold reserves in 2009 under the most recent agreement made in 2004 (500 tonnes a year, 2500 tonnes total).
  • Central banks continue to sell gold and the price continues to rise.
  • Since the late 1980s the purchases of gold by institutional investors has been rising. This trend continues and seems to be picking up momentum.
  • Demand for gold rose sharply in the fourth quarter of 2008, up 27 percent to $26.7 billion (year over year, Q4-2007 versus Q4- 2008.
The current sharp increase in the price of gold can be explained by the sharp increase in demand. Much of this demand is coming from retail investors (GLD), institutional investors, and large purchases from China and India. Central banks continue to sell gold and are in the process of formulating a new plan for selling gold into the market. The fact that the market continues to take these central bank sales indicates there is good ongoing demand for physical gold (since 2000).

Next time I'll write more about,
  • Why gold is going up and should continue to go up.
  • The strong seasonal tendency in gold. Gold usually goes down from March to October and usually soars from October to March. I'll explain why.
  • Why the Chinese are fascinated with gold and are likely to purchase enormous amounts of gold.
  • Why I believe gold is going to perform much like the bull market we saw in oil during 2007-2008.
  • And, the best ways to invest in gold.

Bob DeMarco is a citizen journalist, blogger, and Caregiver. In addition to being an experienced writer he taught at the University of Georgia , was an Associate Diretor and Limited Parther at Bear Stearns, CEO of IP Group, and is a mentor. He currently resides in Delray Beach, FL where he cares for his mother, Dorothy, who suffers from Alzheimer's disease. Bob has written more than 500 articles with more than 11,000 links to his work on the Internet. The content ha been syndicated by Reuters, the Wall Street Journal, Fox News, Pluck, BlogCritics, and a growing list of newspaper websites. Bob is actively seeking syndication and writing assignments.


More from All American Investor


Thursday, January 22, 2009

Bargain hunting dominates Bay Area home sales in December


This is how things should work. The simple law of supply and demand. This is the way to get out of this housing mess; not by artificial proping up prices and home ownership. By the time the supposed housing "bailout" gets in place much of the problem will have taken care of itself. Whatever happened to buy low, sell high? Sharp investors are getting houses at good prices. It seems that banks are in fact lending. And why not? They need to get these foreclosed homes off their books and the only way to do it is to find "real qualified buyers" and offer the homes at prices that entice potential buyers to act.
Bargain hunting dominated the Bay Area housing market last month as the purchase of foreclosure properties accounted for more than half of all resales for the first time. Sales patterns also reflected continued problems for buyers looking to finance purchases in the upper half of the market's price range, a real estate information service reported.

A total of 6,889 new and resale houses and condos were sold in the nine- county region last month. That was up 19.7 percent from 5,756 in November, and up 36.0 percent from 5,065 for December 2007, according to MDA DataQuick.

While sales were well below the 8,807 average for all Decembers going back to 1988, they were no longer at the record low levels of late 2007 and the first half of 2008.
Subscribe to All American Investor via Email


Bargain hunting dominates Bay Area home sales in December


La Jolla, CA.----Bargain hunting dominated the Bay Area housing market last month as the purchase of foreclosure properties accounted for more than half of all resales for the first time. Sales patterns also reflected continued problems for buyers looking to finance purchases in the upper half of the market's price range, a real estate information service reported.

A total of 6,889 new and resale houses and condos were sold in the nine- county region last month. That was up 19.7 percent from 5,756 in November, and up 36.0 percent from 5,065 for December 2007, according to MDA DataQuick.

While sales were well below the 8,807 average for all Decembers going back to 1988, they were no longer at the record low levels of late 2007 and the first half of 2008.

The median price paid for a Bay Area home was $330,000 in December. That was down 5.7 percent from $350,000 for the month before, and down 43.8 percent from $587,500 for December 2007. That was the lowest it has been since March 2000 when the median was $320,500, and 50.4% below the $665,000 peak of June/July 2007.

"It would be wrong to say that Bay Area home values are half of what they were a year-and-a-half ago. We're figuring that maybe half of the decline in median is a market mix issue, and the rest a drop in value. But we're in the middle of this, and we won't be able to quantify it until it's behind us. What is remarkable, is that so much Bay Area activity is still on hold, waiting the turbulence out. We don't know how long that can last," said John Walsh, MDA DataQuick president.

Home loans for more than $417,000, the old "jumbo" limit, used to account for more than 60 percent of the Bay Area's purchase financing. Last month it was 21.8 percent.

The most active lenders to Bay Area home buyers were Countrywide, Bank of America and Wells Fargo. MDA DataQuick will report more extensively on the home financing market next month.

Homes that were foreclosed on accounted for 50.0 percent of December's resale activity, up from 46.8 percent in November, and up from 14.0 percent for December a year ago. Foreclosure resales ranged from 12.4 percent in San Francisco last month to 67.7 percent in Solano County.

MDA DataQuick is a division of MDA Lending Solutions, a subsidiary of Vancouver-based MacDonald Dettwiler and Associates. MDA DataQuick monitors real estate activity nationwide and provides information to consumers, educational institutions, public agencies, lending institutions, title companies and industry analysts.

The typical monthly mortgage payment that Bay Area buyers committed themselves to paying was $1,471 last month, down from a revised $1,695 for the previous month, and down from a revised $2,848 for December year ago. Adjusted for inflation, current payments were 43.9 percent below typical payments in the spring of 1989, the peak of the prior real estate cycle. They were 58.5 percent below the current cycle's peak in July 2007.

Indicators of market distress continue to move in different directions. Foreclosure activity waned in early fall but is edging higher again and remains near record levels, while financing with adjustable-rate mortgages is at an all-time low, as is financing with multiple mortgages. Down payment sizes and flipping rates are stable, non-owner occupied buying activity appears flat, MDA DataQuick reported.


Sales Volume Median Price
All homes Dec-07 Dec-08 %Chng Dec-07 Dec-08 %Chng
Alameda 983 1,492 51.8% $540,000 $338,000 -37.4%
Contra Costa 971 1,788 84.1% $505,000 $252,500 -50.0%
Marin 193 165 -14.5% $760,500 $562,500 -26.0%
Napa 72 111 54.2% $590,000 $402,500 -31.8%
Santa Clara 1,265 1,265 0.0% $655,000 $436,000 -33.4%
San Francisco 445 366 -17.8% $731,000 $616,500 -15.7%
San Mateo 468 435 -7.1% $733,500 $537,000 -26.8%
Solano 360 733 103.6% $370,000 $213,500 -42.3%
Sonoma 308 534 73.4% $410,000 $300,000 -26.8%
Bay Area 5,065 6,889 36.0% $587,500 $330,000 -43.8%
Source: DataQuick Information Systems, www.DQNews.com Media calls: Andrew LePage (916) 456-7157 or John Karevoll (909) 867-9534

Copyright 2008 DataQuick Information Systems. All rights reserved.