How to make money in the market...look beyond the obvious...spot the trends...and do your homework.
Showing posts with label year. Show all posts
Monday, May 17, 2010
Saturday, November 14, 2009
Saturday, June 06, 2009
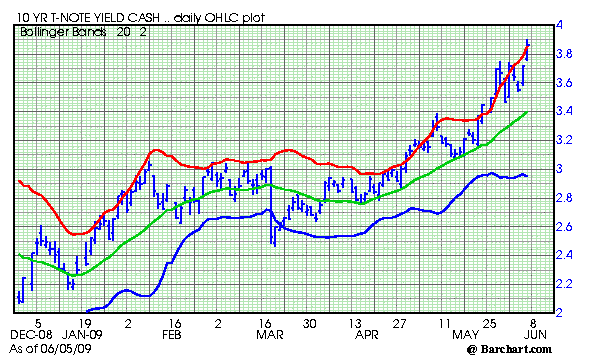
Ten Year Treasury Yield in Orbit (Graph)
Our new song is, there ain't no stopping it now. Oh, the Treasury will come in and buy some size in longer dated Treasuries and mortgage back securities, forcing a short lived, temporary drop in rates from time to time.
As you can see if you look at the red line on the chart, this market continues to stay overbought. This is not a negative sign, quite the opposite, it signals the enormous strength of this trend up in interest rates.
Expect the Fed to defend the 4.00% with both hands and both feet. It will be interesting to see if they can stem the tide of rising interest rates in the longer end of the market.
This rise in ten year interest rates has lots of negative implications. However, the single biggest negative is simple --the refinancing boom is over. With mortgage rates well over 5 percent now, the economics won't work for the vast number of mortgage owners that refinanced in prior drops into the current area.
More from All American Investor
Kindle: Amazon's 6" Wireless Reading Device
Subscribe to All American Investor via Email
Bob DeMarco is a citizen journalist and twenty year Wall Street veteran. Bob has written more than 500 articles with more than 11,000 links to his work on the Internet. Content from All American Investor has been syndicated on Reuters, the Wall Street Journal, Fox News, Pluck, Blog Critics, and a growing list of newspaper websites. Bob is actively seeking syndication and writing assignments. |
More from All American Investor

- Ten Year Treasury Yield in Orbit (Graph)
- Ten Year Interest Rates Rising (Chart)
- Systemic Risk Defined--Too Big to Fail
- Ray Dalio on the current state of affairs in the market
- Roubini Predicts U.S. Losses May Reach $3.6 Trillion
- Option ARM--The Toxic Mortgage
- 60 Minutes -- Cold Fusion
Kindle: Amazon's 6" Wireless Reading Device Tuesday, June 02, 2009
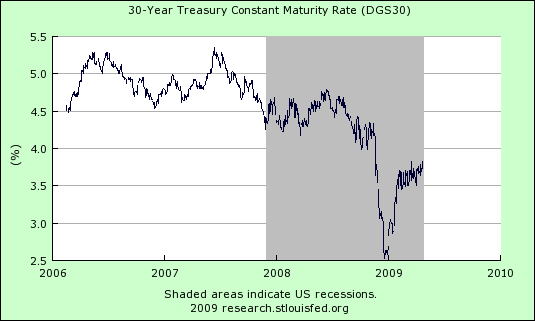
30 Year Treasury Bond Constant Maturity (Chart)
30 Year Treasury, Constant Maturity, Chart

The Chart tells the story.
Kindle: Amazon's Wireless Reading Device (Latest Generation)

The Chart tells the story.
Subscribe to All American Investor via Email
Wednesday, May 27, 2009
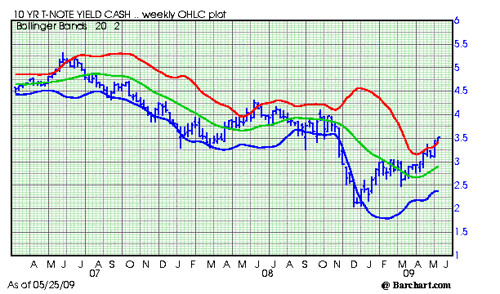
Ten Year Interest Rates Rising (Chart)
Ten Year, Interest Rate View, Chart, Monthly Bar Chart

The Ten Year Note interest rate continues to rise. Right now, it is somewhat overbought.
Long term interest are on the rise. The FED continues to try and hold interest rates down. This is reflected by the steepening of the yield curve.
The bad news here is that mortgage rates are driven by the ten year yield and are now above five percent.
Kindle: Amazon's Wireless Reading Device (Latest Generation)
Follow All American Investor on Twitter

The Ten Year Note interest rate continues to rise. Right now, it is somewhat overbought.
Long term interest are on the rise. The FED continues to try and hold interest rates down. This is reflected by the steepening of the yield curve.
The bad news here is that mortgage rates are driven by the ten year yield and are now above five percent.
Subscribe to All American Investor via Email
Bob DeMarco is a citizen journalist and twenty year Wall Street veteran. Bob has written more than 500 articles with more than 11,000 links to his work on the Internet. Content from All American Investor has been syndicated on Reuters, the Wall Street Journal, Fox News, Pluck, Blog Critics, and a growing list of newspaper websites. Bob is actively seeking syndication and writing assignments. |
Follow All American Investor on Twitter
Wednesday, May 13, 2009
30 Year Conventional Mortgage Rate Ticks Up (Chart)
Slight up tick but still below 5 percent. Fed buying of mortgage backed securities and treasuries is still holding rates down.

Follow All American Investor on Twitter

Subscribe to All American Investor via Email
Follow All American Investor on Twitter
Wednesday, May 06, 2009
30 Year Conventional Mortgage Rate (Chart, 0506)

30 Year Mortgage
- Mortgage interest rate remain low and are hovering around 4.80 percent.
- Meanwhile, the ten year Treasury yield is rising and mortgages are tied to treasuries in the long run.
- Mortgage interest rates remain low as the FED continues to buy mortgage backed securities and add them to their balance sheet.
- The FED action is capping rates in the mortgage area for now.
Subscribe to All American Investor via Email
Follow All American Investor on Twitter
Sunday, April 26, 2009
30 Year Goverment Bond Signaling Problems Ahead (Chart)
Thirty Year Government Bond, Daily Price.
The 30 year Treasury Bond yield is drifting slowly upwards. This indicates there is little interest in the bond. With a slew of government debt on the horizon this does not bode well.
The thirty year remains a good proxy of future inflation expectations and should be watched closely. This is exactly what we intend to do.

More from All American Investor
Follow All American Investor on Twitter
The 30 year Treasury Bond yield is drifting slowly upwards. This indicates there is little interest in the bond. With a slew of government debt on the horizon this does not bode well.
The thirty year remains a good proxy of future inflation expectations and should be watched closely. This is exactly what we intend to do.

Subscribe to All American Investor via Email
Bob DeMarco is a citizen journalist and twenty year Wall Street veteran. Bob has written more than 500 articles with more than 11,000 links to his work on the Internet. Content from All American Investor has been syndicated on Reuters, the Wall Street Journal, Fox News, Pluck, Blog Critics, and a growing list of newspaper websites. Bob is actively seeking syndication and writing assignments. |
More from All American Investor
- 30 Year Conventional Mortgage Rate (Chart)
- Top Hedge Fund Managers Make Billions in 2008
- Systemic Risk Defined--Too Big to Fail
- Ray Dalio on the current state of affairs in the market
- Roubini Predicts U.S. Losses May Reach $3.6 Trillion
- Option ARM--The Toxic Mortgage
- Warren Buffett's Annual Letter to Investors (Cliff Notes Version)
Follow All American Investor on Twitter
Wednesday, April 08, 2009
30 Year Treasury in Perspective (Graph)
The 30 Year Treasury Constant Maturity.

Notes:
Follow All American Investor on Twitter
More from All American Investor

Notes:
- Unless you are over 50 years old, it is probably hard to believe that the 30 year Treasury bond traded above 15 percent.
- In 1982, you could have bought a $1,000,000 Treasury zero coupon bond for $15,000. This allowed you to lock in a compounded interest rate of 15 percent for 30 years. Imagine investing $15,000 of your IRA or 401K and watching it grow, risk free, to $1,000,000.
- Recently, the 30 year spiked down to the 2.50 percent area and right back to the 3.50 percent area.
- The low yield for the long term treasury bond is in, and rates should begin to move higher soon.
- Interest rate trends tend to persist. They tend to last for long periods of time.
- The spike low in the 2.50 area on the long bond is evidence of a final extreme in long term rates.
- Interest rates tend to go to an extreme when making a high or a low.
Yields on actively traded non-inflation-indexed issues adjusted to constant maturities. The 30-year Treasury constant maturity series was discontinued on February 18, 2002, and reintroduced on February 9, 2006.
Subscribe to All American Investor via Email
Bob DeMarco is a citizen journalist and twenty year Wall Street veteran. Bob has written more than 500 articles with more than 11,000 links to his work on the Internet. Content from All American Investor has been syndicated on Reuters, the Wall Street Journal, Fox News, Pluck, Blog Critics, and a growing list of newspaper websites. Bob is actively seeking syndication and writing assignments. |
Follow All American Investor on Twitter
More from All American Investor
- 30 Year Conventional Mortgage Rate (Chart)
- Top Hedge Fund Managers Make Billions in 2008
- Systemic Risk Defined--Too Big to Fail
- Ray Dalio on the current state of affairs in the market
- Roubini Predicts U.S. Losses May Reach $3.6 Trillion
- Option ARM--The Toxic Mortgage
- Warren Buffett's Annual Letter to Investors (Cliff Notes Version)
Tuesday, April 07, 2009
Ten Year Treasury Perspective (Chart)
Notes:
- Every time I look at this chart I think about 1978-82.
- During that period it was not unusual to watch the 3 month Treasury bill move 50 basis points in a day.
- On a slow day the trading range in the Ten Year was a point and one-half.
- Interest Rates on the Ten Year Treasury rose over 15 percent. Mortgage rates also moved above 15 percent.
- Everyone was so bearish they wouldn't touch the Ten Year or Long Bond.
- I continue to ask myself, will we see double digit ten year Treasury rates again?
- The obvious answer is, YES.
- Flash forward 30 years.
- The Ten Year is trading at 2.91 percent. Will rates ever go up?
- It looks like the Ten Year is making a low in this area.
- A close above 3.125 percent would indicate higher interest rates and a trend change.
- I learned a long time ago that trends start when you least expect them.
- Once a trend starts it tends to persist for a long time.
- One thing I know for sure -- rates always go a lot lower, and a lot higher than you could have ever expected--at the extremes.
- Investors should be thinking about ways to take advantage of increases in interest rates.
- Once rates start up they should do so for many years.
Subscribe to All American Investor via Email
Bob DeMarco is a citizen journalist and twenty year Wall Street veteran. Bob has written more than 500 articles with more than 11,000 links to his work on the Internet. Content from All American Investor has been syndicated on Reuters, the Wall Street Journal, Fox News, Pluck, Blog Critics, and a growing list of newspaper websites. Bob is actively seeking syndication and writing assignments. |
Saturday, March 28, 2009
Tuesday, March 24, 2009
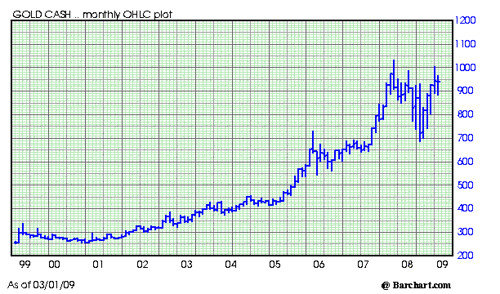
Gold Ten Year Chart and Highlights
This is the cash chart for Gold. Each Bar equals one month. Time frame, 1999-2009.
Some Gold Chart facts:
- The low in Gold was made during March, 2001 around the 255.00 level.
- The high in Gold was made during March, 2008 around the 1,032.00 level.
- Every year from 2001 to 2008, Gold made a new high for the move.
- Gold plunged for most of 2008 and made its low during October, 2008 around the 682.00 level.
- Gold touched 1,000 for the second time February, 2009.
- Seasonal demand for Gold is low during the Spring months.
- Seasonal demand for Gold is usually very strong in the second half of the year.
If you are interested in receiving more information on Gold from All American Investor you can subscribe free via email, RSS, or Twitter.
Subscribe to All American Investor via Email
Saturday, March 14, 2009
Saturday, February 28, 2009
10-Year Treasury Constant Maturity Rate
Ten year Treasury yields are at their lowest levels in more than 45 years. You will notice the peak yield, above 15 percent, occurred in 1982. File this one under food for thought. Click the link in the chart for the larger view or to change the time frame.
Subscribe to:
Posts (Atom)