Showing posts with label term. Show all posts

Saturday, June 06, 2009

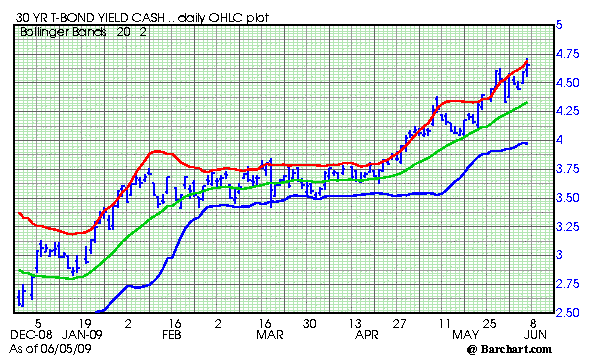
Bond Vigilantes Take over in the Long End (Graph)


30 Year Bond Infaltion Vigilantes Take Over (Graph)

If you were around during the 1980s you know all about the bond vigilantes. When inflation is on the horizon they take over in the long end of the Treasury market.

The 30 year chart above shows that institutional investors are worried about the current policies of the Federal Reserve and Treasury. When this occurs, a interest rate risk premium gets built into the bond. In other words, investors want a bigger cushion to accept the risk of investing in long term Treasury Bonds.

These interest rates look high in comparison to recent history. However, if you are old enough you will remember when the long bond traded above 15 percent. Right now, if you told someone you believed that could happen again, they would tell you -- you are nuts.

They told me I was nuts when I wrote about fire not smoke, when the S and P 500 was in the 1250 area. Nobody thought we could see the stock market fall in half from those levels.

Over the next few years, talk about a downgrade of U.S. debt is going to increase. It appears right now that the downgrade is inevitable. However, it is probably two to four years in the future. The market will discount the downgrade before it happens.

Expect 30 year Treasury bond yields to continue to rise for the foreseeable future. Constant Treasury intervention to try and hold down long term interest rates will fail.

Remember when the Treasury intervened in the Gold market over and over to try and hold prices down?
Subscribe to All American Investor via Email


Bob DeMarco is a citizen journalist and twenty year Wall Street veteran. Bob has written more than 500 articles with more than 11,000 links to his work on the Internet. Content from All American Investor has been syndicated on Reuters, the Wall Street Journal, Fox News, Pluck, Blog Critics, and a growing list of newspaper websites. Bob is actively seeking syndication and writing assignments.


More from All American Investor


Kindle: Amazon's 6" Wireless Reading Device


Follow All American Investor on Twitter

Wednesday, April 08, 2009

30 Year Treasury in Perspective (Graph)


The 30 Year Treasury Constant Maturity.

30 Year Treasury Constant 407


Notes:
  • Unless you are over 50 years old, it is probably hard to believe that the 30 year Treasury bond traded above 15 percent.
  • In 1982, you could have bought a $1,000,000 Treasury zero coupon bond for $15,000. This allowed you to lock in a compounded interest rate of 15 percent for 30 years. Imagine investing $15,000 of your IRA or 401K and watching it grow, risk free, to $1,000,000.
  • Recently, the 30 year spiked down to the 2.50 percent area and right back to the 3.50 percent area.
  • The low yield for the long term treasury bond is in, and rates should begin to move higher soon.
  • Interest rate trends tend to persist. They tend to last for long periods of time.
  • The spike low in the 2.50 area on the long bond is evidence of a final extreme in long term rates.
  • Interest rates tend to go to an extreme when making a high or a low.
Yields on actively traded non-inflation-indexed issues adjusted to constant maturities. The 30-year Treasury constant maturity series was discontinued on February 18, 2002, and reintroduced on February 9, 2006.
Subscribe to All American Investor via Email


Bob DeMarco is a citizen journalist and twenty year Wall Street veteran. Bob has written more than 500 articles with more than 11,000 links to his work on the Internet. Content from All American Investor has been syndicated on Reuters, the Wall Street Journal, Fox News, Pluck, Blog Critics, and a growing list of newspaper websites. Bob is actively seeking syndication and writing assignments.

Follow All American Investor on Twitter

More from All American Investor


Tuesday, March 17, 2009

S and P 500 Current Bear Market (Chart) March 17


The slope of the green line continues to point downward leaving the market vulnerable to the downside. The blue and red lines continues to close indicating a consolidation is in place.

The short term trend is flat. The intermediate and longer term trends are still down at this time. As is obvious, the resistance is up near 800, and support is down near 666. The market should find near term resistance at 775-780, and near term support at 725-730.

Use this link for a larger, more flexible version of the chart.

June S and P Future March 17


Follow All American Investor on Twitter

Friday, February 27, 2009

Stock Market still under extreme pressure--25 year look--Chart


The chart below spans twenty five years for the S and P 500. Each bar is one month.

I have been writing for two weeks about the downside range expansion in the market (see previous posts). The range expansion is still in force. Last time, I mentioned that the market rarely closes lower 7 days in a row and it was due for a rally from the 741 area. The rallies which usually last two days came and went like the weather in Amarillo.

I want to issue a major note of caution here. The formation above could be signaling a market capitulation. Think about it like flushing a toilet. You know what goes down the toilet=, but then the bowl fills right back up. My guess is, if flushed it will be a great opportunity. Markets rarely capitulate, however, when everyone is looking for it.
A look at this long term pattern shows that the market is extremely vulnerable. The fundamental news, especially the size of budget deficit continues to weigh on the market. The only question now is do we go down slow or fast.

For today, the S and P will find good support on any thrust under 732. So don't get nutty with the short positions.

This will be the third straight week down and sixth out of the last seven. This indicates the market is due for a good rally soon. But from what level? New shorts at this level don't make much sense.
clipped from charts.barchart.com

Chart for S and P 500


Subscribe to All American Investor via Email


Follow us on Twitter

Bob DeMarco is a citizen journalist, blogger, and Caregiver. In addition to being an experienced writer he taught at the University of Georgia , managed on Wall Street at Bear Stearns, was CEO of IP Group, and is a mentor. Bob currently resides in Delray Beach, FL where he cares for his mother, Dorothy, who suffers from Alzheimer's disease. Bob has written more than 500 articles with more than 11,000 links to his work on the Internet. His content has been syndicated on Reuters, the Wall Street Journal, Fox News, Pluck, BlogCritics, and a growing list of newspaper websites (15). Bob is actively seeking writing assignments and syndication.


More from All American Investor