Economics
This Week’s Data
Goldman looks at the current risks to the US economy (medium):
http://pragcap.com/goldman-sachs-the-risks-that-will-derail-the-rally
US taxes versus debt (short):
http://www.zerohedge.com/news/taxes-vs-debt-where-does-us-funding-come-chart-day
The Chicago Fed National Activity Index improves (short):
http://mjperry.blogspot.com/2012/08/85-variable-chicago-fed-national.html
Showing posts with label FED. Show all posts
Showing posts with label FED. Show all posts
Tuesday, August 21, 2012


Thursday, August 16, 2012
Morning Journal-Bernanke's mistakes
Economics
This Week’s Data
July industrial production was reported at +0.6% versus expectations of +0.5%; capacity utilization came in at 79.4% versus estimates of 79.2%.
http://scottgrannis.blogspot.com/2012/08/industrial-production-remains-healthy.html
Weekly jobless claims rose 5,000 versus forecasts of up 1,000.
http://www.calculatedriskblog.com/2012/08/weekly-initial-unemployment-claims_16.html
July housing starts fell 1.8% versus expectations of a 1.3% drop; however, building permits soared 7.5% versus estimates of a 1.5% increase.
This Week’s Data
July industrial production was reported at +0.6% versus expectations of +0.5%; capacity utilization came in at 79.4% versus estimates of 79.2%.
http://scottgrannis.blogspot.com/2012/08/industrial-production-remains-healthy.html
Weekly jobless claims rose 5,000 versus forecasts of up 1,000.
http://www.calculatedriskblog.com/2012/08/weekly-initial-unemployment-claims_16.html
July housing starts fell 1.8% versus expectations of a 1.3% drop; however, building permits soared 7.5% versus estimates of a 1.5% increase.
Sunday, July 25, 2010
Money Supply, M2, Comparison Chart
M2 includes a broader set of financial assets held principally by households. M2 consists of M1 plus: (1) savings deposits (which include money market deposit accounts, or MMDAs); (2) small-denomination time deposits (time deposits in amounts of less than $100,000); and (3) balances in retail money market mutual funds (MMMFs). Seasonally adjusted M2 is computed by summing savings deposits, small-denomination time deposits, and retail MMMFs, each seasonally adjusted separately, and adding this result to seasonally adjusted M1.
Saturday, September 26, 2009
@AllAmerInvest 926
From @AllAmerInvest

The Fed's Job Is Only Half Over
The level of asset prices and associated risk premiums will demand careful assessment as we return to normal.
To continue reading go here.
Group of 20 Agrees on Far-Reaching Economic Plan
Don't bank on your home as an ATM
The economic fundamentals that drove home values up in the 20th century -- sustained growth in incomes, population and household wealth -- have been sputtering for decades. Though the future isn't necessarily bleak, economists say there's no reason Americans should continue to see a home purchase as a path to wealth.
To continue reading go here.
Kindle: Amazon's 6"  Wireless Reading Device
The level of asset prices and associated risk premiums will demand careful assessment as we return to normal.
To continue reading go here.
Group of 20 Agrees on Far-Reaching Economic Plan
Don't bank on your home as an ATM
The economic fundamentals that drove home values up in the 20th century -- sustained growth in incomes, population and household wealth -- have been sputtering for decades. Though the future isn't necessarily bleak, economists say there's no reason Americans should continue to see a home purchase as a path to wealth.
To continue reading go here.
Subscribe to All American Investor via Email
Wireless Reading Device Tuesday, June 16, 2009
Mortgage Interest Rates Go Verticle (Graph)

The negative implications of the sharp rise in mortgage interest rates are to many to list. When interest rates rise house get more expensive. This is likely to slow the economic recovery in housing -- a real negative. Another likely outcome is the end of the refinancing boom.
Let's not forget, the Treasury has been in the markets buying Treasury securities and mortgage backed securities. As we have pointed out for many months, the Treasury balance sheet is exploding with no end in sight. Rates continue to rise against this background.
It should be clear that there is little or nothing that the FED and Treasury can do to stem the rise in longer dated securities.
Here is another little noticed fact that we will be writing about soon. Since June 1, the two year treasury has risen 26 basis points, while the ten year treasury has dropped 4 basis points. This means the yield curve is flattening. Go here for the Daily Treasury Yield Curve Rates.
My guess is in the next 12-18 months the market will realize that stagflation is the name of the game.
This is the worst thing that can happen to the dollar. The only thing that could stem a run on the dollar is FED tightening.
Subscribe to All American Investor via Email
 Bob DeMarco is a citizen journalist and twenty year Wall Street veteran. Bob has written more than 500 articles with more than 11,000 links to his work on the Internet. Content from All American Investor has been syndicated on Reuters, the Wall Street Journal, Fox News, Pluck, Blog Critics, and a growing list of newspaper websites. Bob is actively seeking syndication and writing assignments. Bob DeMarco is a citizen journalist and twenty year Wall Street veteran. Bob has written more than 500 articles with more than 11,000 links to his work on the Internet. Content from All American Investor has been syndicated on Reuters, the Wall Street Journal, Fox News, Pluck, Blog Critics, and a growing list of newspaper websites. Bob is actively seeking syndication and writing assignments. |
More from All American Investor
- Bond Vigilantes Take over in the Long End (Graph)
- Ten Year Treasury Yield in Orbit (Graph)
- Ten Year Interest Rates Rising (Chart)
- Option ARM--The Toxic Mortgage
- Systemic Risk Defined--Too Big to Fail
- Ray Dalio on the current state of affairs in the market
- Roubini Predicts U.S. Losses May Reach $3.6 Trillion
- 60 Minutes -- Cold Fusion


Follow All American Investor on Twitter
Saturday, June 13, 2009
FED Loans to AIG for Credit Default Swaps (Maiden Lane III, Graph)
On November 25, 2008, the Federal Reserve Bank of New York began extending credit to Maiden Lane III LLC.
This limited liability company was formed to purchase multi-sector collateralized debt obligations (CDOs) on which the Financial Products group of American International Group, Inc (AIG) had written credit default swap (CDS) contracts.
Net portfolio holding of Maiden Lane III at peak $28.085 billion (December 24, 2008). Current holding $19.876 billion.
FED continuing to assume risks of these credit default swap transactions.

More from All American Investor
Kindle: Amazon's 6" Wireless Reading Device
Follow All American Investor on Twitter
This limited liability company was formed to purchase multi-sector collateralized debt obligations (CDOs) on which the Financial Products group of American International Group, Inc (AIG) had written credit default swap (CDS) contracts.
Net portfolio holding of Maiden Lane III at peak $28.085 billion (December 24, 2008). Current holding $19.876 billion.
FED continuing to assume risks of these credit default swap transactions.
Subscribe to All American Investor via Email
| Bob DeMarco is a citizen journalist and twenty year Wall Street veteran. Bob has written more than 500 articles with more than 11,000 links to his work on the Internet. Content from All American Investor has been syndicated on Reuters, the Wall Street Journal, Fox News, Pluck, Blog Critics, and a growing list of newspaper websites. Bob is actively seeking syndication and writing assignments. |
More from All American Investor
- Bond Vigilantes Take over in the Long End (Graph)
- Ten Year Treasury Yield in Orbit (Graph)
- Ten Year Interest Rates Rising (Chart)
- Option ARM--The Toxic Mortgage
- Systemic Risk Defined--Too Big to Fail
- Ray Dalio on the current state of affairs in the market
- Roubini Predicts U.S. Losses May Reach $3.6 Trillion
- 60 Minutes -- Cold Fusion
Kindle: Amazon's 6" Wireless Reading Device Follow All American Investor on Twitter
Saturday, June 06, 2009
Bond Vigilantes Take over in the Long End (Graph)
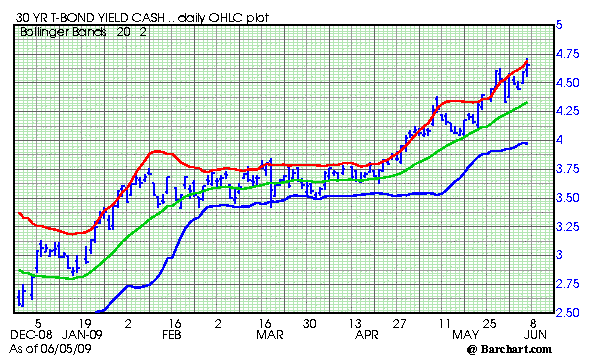
If you were around during the 1980s you know all about the bond vigilantes. When inflation is on the horizon they take over in the long end of the Treasury market.
The 30 year chart above shows that institutional investors are worried about the current policies of the Federal Reserve and Treasury. When this occurs, a interest rate risk premium gets built into the bond. In other words, investors want a bigger cushion to accept the risk of investing in long term Treasury Bonds.
These interest rates look high in comparison to recent history. However, if you are old enough you will remember when the long bond traded above 15 percent. Right now, if you told someone you believed that could happen again, they would tell you -- you are nuts.
They told me I was nuts when I wrote about fire not smoke, when the S and P 500 was in the 1250 area. Nobody thought we could see the stock market fall in half from those levels.
Over the next few years, talk about a downgrade of U.S. debt is going to increase. It appears right now that the downgrade is inevitable. However, it is probably two to four years in the future. The market will discount the downgrade before it happens.
Expect 30 year Treasury bond yields to continue to rise for the foreseeable future. Constant Treasury intervention to try and hold down long term interest rates will fail.
Remember when the Treasury intervened in the Gold market over and over to try and hold prices down?
More from All American Investor
Kindle: Amazon's 6" Wireless Reading Device
Follow All American Investor on Twitter
Over the next few years, talk about a downgrade of U.S. debt is going to increase. It appears right now that the downgrade is inevitable. However, it is probably two to four years in the future. The market will discount the downgrade before it happens.
Expect 30 year Treasury bond yields to continue to rise for the foreseeable future. Constant Treasury intervention to try and hold down long term interest rates will fail.
Remember when the Treasury intervened in the Gold market over and over to try and hold prices down?
Subscribe to All American Investor via Email
| Bob DeMarco is a citizen journalist and twenty year Wall Street veteran. Bob has written more than 500 articles with more than 11,000 links to his work on the Internet. Content from All American Investor has been syndicated on Reuters, the Wall Street Journal, Fox News, Pluck, Blog Critics, and a growing list of newspaper websites. Bob is actively seeking syndication and writing assignments. |
More from All American Investor
- Top Hedge Fund Managers Make Billions in 2008
- Systemic Risk Defined--Too Big to Fail
- Ray Dalio on the current state of affairs in the market
- Roubini Predicts U.S. Losses May Reach $3.6 Trillion
- Option ARM--The Toxic Mortgage
- Warren Buffett's Annual Letter to Investors (Cliff Notes Version)
Kindle: Amazon's 6" Wireless Reading Device Follow All American Investor on Twitter
Wednesday, May 27, 2009
Ten Year Interest Rates Rising (Chart)
Ten Year, Interest Rate View, Chart, Monthly Bar Chart
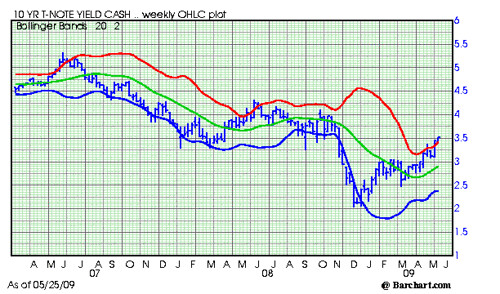
The Ten Year Note interest rate continues to rise. Right now, it is somewhat overbought.
Long term interest are on the rise. The FED continues to try and hold interest rates down. This is reflected by the steepening of the yield curve.
The bad news here is that mortgage rates are driven by the ten year yield and are now above five percent.
Kindle: Amazon's Wireless Reading Device (Latest Generation)
Follow All American Investor on Twitter
The Ten Year Note interest rate continues to rise. Right now, it is somewhat overbought.
Long term interest are on the rise. The FED continues to try and hold interest rates down. This is reflected by the steepening of the yield curve.
The bad news here is that mortgage rates are driven by the ten year yield and are now above five percent.
Subscribe to All American Investor via Email
| Bob DeMarco is a citizen journalist and twenty year Wall Street veteran. Bob has written more than 500 articles with more than 11,000 links to his work on the Internet. Content from All American Investor has been syndicated on Reuters, the Wall Street Journal, Fox News, Pluck, Blog Critics, and a growing list of newspaper websites. Bob is actively seeking syndication and writing assignments. |
Follow All American Investor on Twitter
Saturday, May 23, 2009
Fed Series M2, Money Supply Still Soaring (Chart)
Fed Data, M2, Money Stock, Chart

We wrote several months ago about how it takes 12-18 months for increases in money supply to effect interest rates and commodity prices. We are now in this window.
The dramatic increases in money supply, the Fed balance sheet, and the drop in the dollar are starting to weigh on investor confidence.
Stocks rarely rise when confidence dwindles. It now seems we are moving from what was growing confidence in the markets to growing uncertainty.
The risk of owning equities on a short term basis not outweighs the reward. The threat of rising interest rates has also risen dramatically. This weeks surge in Gold is another barometer of investor confidence.Kindle: Amazon's Wireless Reading Device (Latest Generation)
Follow All American Investor on Twitter
We wrote several months ago about how it takes 12-18 months for increases in money supply to effect interest rates and commodity prices. We are now in this window.
The dramatic increases in money supply, the Fed balance sheet, and the drop in the dollar are starting to weigh on investor confidence.
Stocks rarely rise when confidence dwindles. It now seems we are moving from what was growing confidence in the markets to growing uncertainty.
The risk of owning equities on a short term basis not outweighs the reward. The threat of rising interest rates has also risen dramatically. This weeks surge in Gold is another barometer of investor confidence.
Subscribe to All American Investor via Email
Bob DeMarco is a citizen journalist and twenty year Wall Street veteran. Bob has written more than 500 articles with more than 11,000 links to his work on the Internet. Content from All American Investor has been syndicated on Reuters, the Wall Street Journal, Fox News, Pluck, Blog Critics, and a growing list of newspaper websites. Bob is actively seeking syndication and writing assignments.Bob DeMarco, All American Investor, May 2009
Follow All American Investor on Twitter
Thursday, April 30, 2009
Fed Monetizing Debt -- How long before the Inflation Comes?
No matter how you cut or slice it, the FED is going to monetize debt. This means you want to be owning stocks and ETFs that benefit from an increase in inflation.
Over the next week, we will be putting up some of our ideas on how to take advantage of this scenario.
If you have been following the charts on All American Investor -- you noticed that I have been talking about rising rates in the ten and thirty year treasuries for a few weeks. If you are not paying close attention to this as in investor you are making a big mistake.
The bond vigilantes are coming back, and soon with a vengeance. Longer dated treasury interest rates are drifting up. This, in spite, of massive buying of treasuries by the FED -- we showed the balance sheet on Saturday.
Here is a snippet from the latest FOMC release:
Buy $300 billion of treasuries by Autumn?
The best way to think of the current scenario is like boiling water in a tea pot. Sooner or later, the whistle will blow.
Don't like the above? Remember, I am the same guy that predicted this really in stocks when I wrote:
Over the next week, we will be putting up some of our ideas on how to take advantage of this scenario.
If you have been following the charts on All American Investor -- you noticed that I have been talking about rising rates in the ten and thirty year treasuries for a few weeks. If you are not paying close attention to this as in investor you are making a big mistake.
The bond vigilantes are coming back, and soon with a vengeance. Longer dated treasury interest rates are drifting up. This, in spite, of massive buying of treasuries by the FED -- we showed the balance sheet on Saturday.
Here is a snippet from the latest FOMC release:
As previously announced, to provide support to mortgage lending and housing markets and to improve overall conditions in private credit markets, the Federal Reserve will purchase a total of up to $1.25 trillion of agency mortgage-backed securities and up to $200 billion of agency debt by the end of the year. In addition, the Federal Reserve will buy up to $300 billion of Treasury securities by autumn. The Committee will continue to evaluate the timing and overall amounts of its purchases of securities in light of the evolving economic outlook and conditions in financial markets. The Federal Reserve is facilitating the extension of credit to households and businesses and supporting the functioning of financial markets through a range of liquidity programs. The Committee will continue to carefully monitor the size and composition of the Federal Reserve's balance sheet in light of financial and economic developments.
Buy $300 billion of treasuries by Autumn?
The best way to think of the current scenario is like boiling water in a tea pot. Sooner or later, the whistle will blow.
Don't like the above? Remember, I am the same guy that predicted this really in stocks when I wrote:
- They call me crazy -- S and P 900-1000
- and, Stocks Don't Fight the Tape.
Subscribe to All American Investor via Email
Friday, April 24, 2009
Bear Bailout Cost Fed $3 Billion, So Far
The U.S. Federal Reserve report showed a $3 billion loss on the books from its deal to rescue investment bank Bear Stearns.
The number of greater concern is The Fed's combined assets of $2.25 Trillion as of Dec. 31. This number compares with $1.3 Trillion a year earlier.
The Fed balance sheet is inflationary and anyone who believe otherwise has their head in the sand.
We continue to watch the yield on the Ten Year and Thirty Year Treasury closely. We will be looking at the yield curve and its implications tomorrow.
Fed data shows big losses on Bear Stearns deal
More from All American Investor
Follow All American Investor on Twitter
The number of greater concern is The Fed's combined assets of $2.25 Trillion as of Dec. 31. This number compares with $1.3 Trillion a year earlier.
The Fed balance sheet is inflationary and anyone who believe otherwise has their head in the sand.
We continue to watch the yield on the Ten Year and Thirty Year Treasury closely. We will be looking at the yield curve and its implications tomorrow.
Fed data shows big losses on Bear Stearns deal
Subscribe to All American Investor via Email
| Bob DeMarco is a citizen journalist and twenty year Wall Street veteran. Bob has written more than 500 articles with more than 11,000 links to his work on the Internet. Content from All American Investor has been syndicated on Reuters, the Wall Street Journal, Fox News, Pluck, Blog Critics, and a growing list of newspaper websites. Bob is actively seeking syndication and writing assignments. |
More from All American Investor
- 30 Year Conventional Mortgage Rate (Chart)
- Top Hedge Fund Managers Make Billions in 2008
- Systemic Risk Defined--Too Big to Fail
- Ray Dalio on the current state of affairs in the market
- Roubini Predicts U.S. Losses May Reach $3.6 Trillion
- Option ARM--The Toxic Mortgage
- Warren Buffett's Annual Letter to Investors (Cliff Notes Version)
Follow All American Investor on Twitter
Wednesday, April 15, 2009
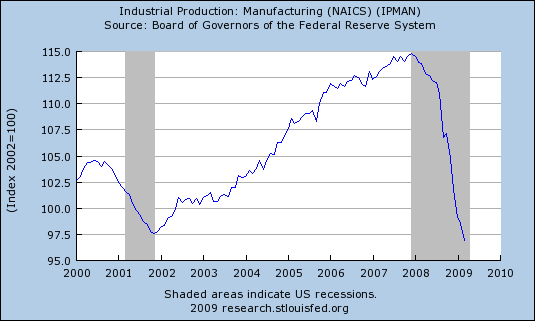
Industrial Production Manufacturing (NAICS, Chart)
Inustrial Production, Manufacturing
Subscribe to All American Investor via Email
Kindle 2: Amazon's New Wireless Reading Device (Latest Generation)
Follow All American Investor on Twitter
Sunday, April 12, 2009
Net Free or Borrowed Reserves Exploding Again (Graph)

From 2003-01-01 till 2007-11-01, the observations reflect excess reserves minus total borrowings plus secondary borrowings. From 2007-12-01, the definition changes to excess reserves minus discount window borrowings plus secondary borrowings. Please, check the latest definition of the discount window borrowings at http://research.stlouisfed.org/fred2/series/DISCBORR.
This explains the attempt to pump up the volume and create profits at banks. Is starting back up and is having an explosive effect.
Subscribe to All American Investor via Email
Follow All American Investor on Twitter
Tuesday, March 31, 2009
M2, Money Supply Continues to Soar
M2, Money Stock, St Louis Fred Graph, March 27, 2009.
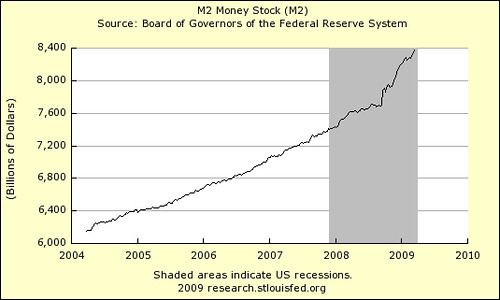

Money Supply as measured by M2 continues to soar. Does anybody really care?
Back in the early 1980s if M2 started rising, the bond vigilantes would have been out in force pushing interest rates higher. Now, not a "peep".
One can only wonder how long it is going to take for this surge in money to take effect. Commodities are at rock bottom as I am writing this.
One thing for sure, if the Fed has acted as it did in the 1930s we would all be eating rocks by now. Potato anyone?
Stay tuned, the fun is going to start very soon.
M2 includes a broader set of financial assets held principally by households. M2 consists of M1 plus:
(1) savings deposits (which include money market deposit accounts, or MMDAs);
(2) small-denomination time deposits (time deposits in amounts of lessthan $100,000);
and (3) balances in retail money market mutual funds(MMMFs).
Seasonally adjusted M2 is computed by summing savings deposits, small-denomination time deposits, and retail MMMFs, each seasonally adjusted separately, and adding this result to seasonally
adjusted M1.
Money Supply as measured by M2 continues to soar. Does anybody really care?
Back in the early 1980s if M2 started rising, the bond vigilantes would have been out in force pushing interest rates higher. Now, not a "peep".
One can only wonder how long it is going to take for this surge in money to take effect. Commodities are at rock bottom as I am writing this.
One thing for sure, if the Fed has acted as it did in the 1930s we would all be eating rocks by now. Potato anyone?
Stay tuned, the fun is going to start very soon.
M2 includes a broader set of financial assets held principally by households. M2 consists of M1 plus:
(1) savings deposits (which include money market deposit accounts, or MMDAs);
(2) small-denomination time deposits (time deposits in amounts of lessthan $100,000);
and (3) balances in retail money market mutual funds(MMMFs).
Seasonally adjusted M2 is computed by summing savings deposits, small-denomination time deposits, and retail MMMFs, each seasonally adjusted separately, and adding this result to seasonally
adjusted M1.
Subscribe to All American Investor via Email


Thursday, February 19, 2009
Is Nouriel Roubini Crying Wolf?
There is no doubt that Professor Nouriel Roubini was one of the first to predict the financial meltdown. He has consistently been ahead of the curve in his predictions. He also seems to be showing up more and more in the media.
In this new video he is decidedly negative on the new housing plan, banks, and the economy. He is not discussing, however, where all the capital would come from to execute his very aggressive plans which he contends are necessary. As I watched the video I started to get the feeling that Roubini is starting to sound like the little boy crying wolf. He continues to say the same thing over and over.
It is easy to sit in an ivory tower and criticize every move. It is another thing to operate in the real world and balance the need to create an orderly, effective stimulus plan and bailout against the background of raising those funds in the world markets. Confidence is a critical issue and a failed Treasury auction would be a disaster. Something of that nature would derail the best laid plans of mice and men.
In this new video he is decidedly negative on the new housing plan, banks, and the economy. He is not discussing, however, where all the capital would come from to execute his very aggressive plans which he contends are necessary. As I watched the video I started to get the feeling that Roubini is starting to sound like the little boy crying wolf. He continues to say the same thing over and over.
It is easy to sit in an ivory tower and criticize every move. It is another thing to operate in the real world and balance the need to create an orderly, effective stimulus plan and bailout against the background of raising those funds in the world markets. Confidence is a critical issue and a failed Treasury auction would be a disaster. Something of that nature would derail the best laid plans of mice and men.
Subscribe to All American Investor via EmailSource: Firedoglake
Tuesday, January 27, 2009
Will the Commercial Paper Market get Tested on Friday?
The Fed launched the Commercial Paper Funding Facility on Oct. 27 to buy short-term debt directly from companies amid the credit market's seizure. Now, the Fed holds about $350 billion of commercial paper in the facility. That is close to 21% of the $1.7 trillion market. About $230 billion of this debt is set to mature by Friday.
By LIZ RAPPAPORT
This week brings one of the first tests of success for a key Federal Reserve program that has calmed the short-term credit markets.
About $230 billion of three-month debt that the Fed owns, in the form of commercial paper, is set to mature by Friday.
The questions are: Will companies like General Electric or GMAC, which issue this short-term debt to pay their bills and meet other near-term obligations, return to the open market rather than roll over their debt with the central bank, which costs a lot more? Can the still-fragile market absorb so much three-month debt in a single week without sending interest rates much higher? And is the Fed winding down this key program?
The Fed launched the Commercial Paper Funding Facility on Oct. 27 to buy short-term debt directly from companies amid the credit market's seizure, following Lehman Brothers' collapse.
At the time, money-market funds, which are the main buyers of this debt, were hoarding cash to meet redemptions and companies couldn't obtain loans for much more than 24 hours, and at rates as high as 7% or more.
GMAC says it is evaluating all of its funding options, while General Electric Chief Executive Jeffrey Immelt said last week the firm was cutting back its reliance on the commercial-paper market.
As of this past Thursday, the Fed held $350 billion of paper in the facility. That is close to 21% of the $1.7 trillion market.
"Unwinding the Fed's programs is meant to be a natural process, and this is an early test of that," said Lou Crandall, chief economist at Wrightson ICAP.
Some analysts predict the Fed may see its CP purchases cut by half as issuers work their way back into the open market.
It is unlikely all the issuers will roll over their debt for three months as some choose to sell at shorter maturities, of one or two months. Others, like banks, may entirely buy back their debt using cash they have obtained by borrowing at lower rates, using debt guaranteed by the Federal Deposit Insurance Corp. Thursday evening the Fed will report its holdings for the prior week.
Certainly, the CPFF program, along with several others, has helped smooth the problems in the short-term credit markets.
Money-market funds have been buying higher-yielding assets rather than just the safest short-term Treasury bills, which yielded them 0% for several weeks. Investors have moved into "prime" money-market funds, which buy higher-yielding assets. Money-fund managers no longer fear the possibility of "breaking the buck," or having the value of each share fall below $1, given the myriad government programs that ensure liquidity to meet any surge in redemptions.
 Commercial-paper rates have also fallen to the point where borrowing from the Fed has become less appealing because it costs more than the open market does -- a phenomenon the Fed engineered. In the open market, companies can issue three-month debt at rates around 1% or less, where the Fed's rates are 1.24% for unsecured commercial paper or 3.24% for paper backed by assets' cash flows.
The Commercial Paper Funding Facility isn't scheduled to expire until the end of April, but as Federal Reserve Chairman Ben Bernanke explained in a Jan. 13 speech in London, "unwinding will happen automatically, as improvements in credit markets should reduce the need to use Fed facilities."
The Fed's balance sheet has already shrunk since the start of the year, from $2.26 trillion on Dec. 31 to $2.04 billion as of last Thursday. That said, it's still massively oversized from under $900 billion prior to Lehman's bankruptcy filing last September.
About $60 billion of the shrinkage came from allowing an older, now unnecessary, liquidity facility to expire. About $135 billion is due to a decline in short-term lending facilities, which were heavily used by banks and other financial institutions to get through year-end funding pressures, according to Fed data.
The remainder was due to modest ups and downs in a variety of facilities, and some currency valuation adjustments.
Write to Liz Rappaport at liz.rappaport@wsj.com
The question: Will companies like General Electric or GMAC, which issue this short-term debt to pay their bills and meet other near-term obligations, return to the open market rather than roll over their debt with the central bank.With the market looking on two additional question will be answered:
- Is the open market capable and willing to fund these companies?
- If they return to the open market what will be the cost of funding their obligations?
Subscribe to All American Investor via Email
Fed Program That Calmed Debt Market Faces a Test
By LIZ RAPPAPORT
This week brings one of the first tests of success for a key Federal Reserve program that has calmed the short-term credit markets.
About $230 billion of three-month debt that the Fed owns, in the form of commercial paper, is set to mature by Friday.
The questions are: Will companies like General Electric or GMAC, which issue this short-term debt to pay their bills and meet other near-term obligations, return to the open market rather than roll over their debt with the central bank, which costs a lot more? Can the still-fragile market absorb so much three-month debt in a single week without sending interest rates much higher? And is the Fed winding down this key program?
The Fed launched the Commercial Paper Funding Facility on Oct. 27 to buy short-term debt directly from companies amid the credit market's seizure, following Lehman Brothers' collapse.
At the time, money-market funds, which are the main buyers of this debt, were hoarding cash to meet redemptions and companies couldn't obtain loans for much more than 24 hours, and at rates as high as 7% or more.
GMAC says it is evaluating all of its funding options, while General Electric Chief Executive Jeffrey Immelt said last week the firm was cutting back its reliance on the commercial-paper market.
As of this past Thursday, the Fed held $350 billion of paper in the facility. That is close to 21% of the $1.7 trillion market.
"Unwinding the Fed's programs is meant to be a natural process, and this is an early test of that," said Lou Crandall, chief economist at Wrightson ICAP.
Some analysts predict the Fed may see its CP purchases cut by half as issuers work their way back into the open market.
It is unlikely all the issuers will roll over their debt for three months as some choose to sell at shorter maturities, of one or two months. Others, like banks, may entirely buy back their debt using cash they have obtained by borrowing at lower rates, using debt guaranteed by the Federal Deposit Insurance Corp. Thursday evening the Fed will report its holdings for the prior week.
Certainly, the CPFF program, along with several others, has helped smooth the problems in the short-term credit markets.
Money-market funds have been buying higher-yielding assets rather than just the safest short-term Treasury bills, which yielded them 0% for several weeks. Investors have moved into "prime" money-market funds, which buy higher-yielding assets. Money-fund managers no longer fear the possibility of "breaking the buck," or having the value of each share fall below $1, given the myriad government programs that ensure liquidity to meet any surge in redemptions.
Commercial-paper rates have also fallen to the point where borrowing from the Fed has become less appealing because it costs more than the open market does -- a phenomenon the Fed engineered. In the open market, companies can issue three-month debt at rates around 1% or less, where the Fed's rates are 1.24% for unsecured commercial paper or 3.24% for paper backed by assets' cash flows.The Commercial Paper Funding Facility isn't scheduled to expire until the end of April, but as Federal Reserve Chairman Ben Bernanke explained in a Jan. 13 speech in London, "unwinding will happen automatically, as improvements in credit markets should reduce the need to use Fed facilities."
The Fed's balance sheet has already shrunk since the start of the year, from $2.26 trillion on Dec. 31 to $2.04 billion as of last Thursday. That said, it's still massively oversized from under $900 billion prior to Lehman's bankruptcy filing last September.
About $60 billion of the shrinkage came from allowing an older, now unnecessary, liquidity facility to expire. About $135 billion is due to a decline in short-term lending facilities, which were heavily used by banks and other financial institutions to get through year-end funding pressures, according to Fed data.
The remainder was due to modest ups and downs in a variety of facilities, and some currency valuation adjustments.
Write to Liz Rappaport at liz.rappaport@wsj.com
Monday, January 26, 2009
Will the Fed Try to 'Rig' the Long Term Treasury Market?
It appears that Fed policy makers are exploring the purchase of longer-dated Treasury securities in an effort to push up their price and bring down their yield. This reminded me immediately of the Treasuries effort to manipulate the price of gold in the late 1970s. In an attempt to do this, the Treasury started periodic sales of gold. As I recall, they started selling gold into the market around $175 an ounce. They finally gave up when gold reached well into the $400s. They sold not a single ounce as gold soared up and over $800. My point here is simple--you cannot 'rig' the markets no matter how hard you try. Eventually the rubber band breaks and most times the resulting equal and opposite reaction is chaos.
My guess is that the only thing the Fed will accomplish is to bring wild and crazy swings into the Treasury market. In other words, volatility. In the late 1970s and early 80s it was not unusual to see the long bonds move 2 or more points in a day. The daily trading ranges often exceeded 3 points. Around the same time it was not unusual to see short term rates, treasury bills, move in trading ranges greater than one percent a week. So far interest rates have been relatively tame.
It seems that nothing much changes. The "new new" thing here is to use taxpayer money or federal balance sheet leverage to cure the "sick patient". Will this work, I doubt it. My guess is we take our medicine and eventually things smooth out and then we get on a rehab program. All of this takes time. There are no overnight solutions. You can take your three antibiotic pills a day for ten days and soon enough you will be feeling better. But guess what, if you take all 30 in a single day they won't work and worse, you'll suffer from a very nasty and negative reaction.
It should be apparent that Federal regulators are running out of bullets. My suggestion is we get these guys into the Economics 101 course to revisit the laws of supply and demand. In my opinion, understanding the supply/demand equation is the real long term answer to our current economic woes.
Subscribe to All American Investor via Email
My guess is that the only thing the Fed will accomplish is to bring wild and crazy swings into the Treasury market. In other words, volatility. In the late 1970s and early 80s it was not unusual to see the long bonds move 2 or more points in a day. The daily trading ranges often exceeded 3 points. Around the same time it was not unusual to see short term rates, treasury bills, move in trading ranges greater than one percent a week. So far interest rates have been relatively tame.
It seems that nothing much changes. The "new new" thing here is to use taxpayer money or federal balance sheet leverage to cure the "sick patient". Will this work, I doubt it. My guess is we take our medicine and eventually things smooth out and then we get on a rehab program. All of this takes time. There are no overnight solutions. You can take your three antibiotic pills a day for ten days and soon enough you will be feeling better. But guess what, if you take all 30 in a single day they won't work and worse, you'll suffer from a very nasty and negative reaction.
It should be apparent that Federal regulators are running out of bullets. My suggestion is we get these guys into the Economics 101 course to revisit the laws of supply and demand. In my opinion, understanding the supply/demand equation is the real long term answer to our current economic woes.
Bernanke Risks ‘Very Unstable’ Market as He Weighs Buying Bonds
Wednesday, April 09, 2008

Subscribe to:
Posts (Atom)