Showing posts with label fred graph. Show all posts

Sunday, November 20, 2011

M2, Money Supply Billions of Dollars, Percent Change from A Year Ago (Graph, 1111)


M2 includes a broader set of financial assets held principally by households. M2 consists of M1 plus: (1) savings deposits (which include money market deposit accounts, or MMDAs); (2) small-denomination time deposits (time deposits in amounts of less than $100,000); and (3) balances in retail money market mutual funds (MMMFs).

Seasonally adjusted M2 is computed by summing savings deposits, small-denomination time deposits, and retail MMMFs, each seasonally adjusted separately, and adding this result to seasonally adjusted M1

Billions of Dollars

All American Investor

Tuesday, June 16, 2009

Housing Starts Graph and Statistics


Housing Starts


Subscribe to All American Investor via Email

The U.S. Census Bureau and the Department of Housing and Urban Development jointly announced the following new residential construction statistics for May 2009.

BUILDING PERMITS
  • Privately-owned housing units authorized by building permits in May were at a seasonally adjusted annual rate of 518,000.
  • This is 4.0 percent above the revised April rate of 498,000, but is 47.0 percent below the May 2008 estimate of 978,000.
  • Single-family authorizations in May were at a rate of 408,000; this is 7.9 percent above the revised April figure of 378,000.

HOUSING STARTS
  • Privately-owned housing starts in May were at a seasonally adjusted annual rate of 532,000.
  • This is 17.2 percent above the revised April estimate of 454,000, but is 45.2 percent below the May 2008 rate of 971,000.
  • Single-family housing starts in May were at a rate of 401,000; this is 7.5 percent above the revised April figure of 373,000.
  • The May rate for units in buildings with five units or more was 124,000.
HOUSING COMPLETIONS
  • Privately-owned housing completions in May were at a seasonally adjusted annual rate of 811,000. This is 3.3 percent.
  • below the revised April estimate of 839,000 and is 28.8 percent below the May 2008 rate of 1,139,000.
  • Single-family housing completions in May were at a rate of 491,000; this is 9.4 percent below the revised April figure of 542,000.
  • The May rate for units in buildings with five units or more was 314,000.

Bob DeMarco is a citizen journalist and twenty year Wall Street veteran. Bob has written more than 500 articles with more than 11,000 links to his work on the Internet. Content from All American Investor has been syndicated on Reuters, the Wall Street Journal, Fox News, Pluck, Blog Critics, and a growing list of newspaper websites. Bob is actively seeking syndication and writing assignments.


More from All American Investor

Kindle: Amazon's 6" Wireless Reading Device


Follow All American Investor on Twitter

Wednesday, April 15, 2009

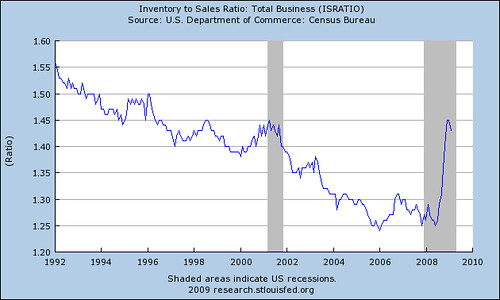
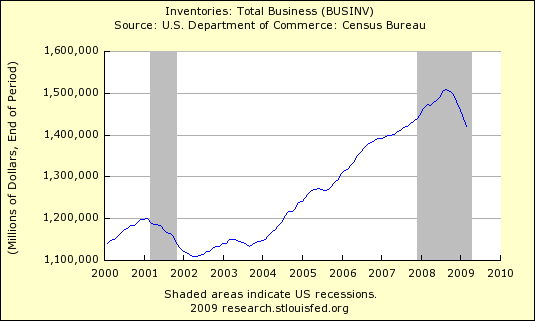
Inventories, Inventory to Sales Ratio (Charts)


Inventories being reduced.

Inventories 415
Subscribe to All American Investor via Email


Inventory to sales ratio peaking? Similar to 2001 recession?

Inventory to Sales Ratio 415


Follow All American Investor on Twitter

Saturday, April 04, 2009

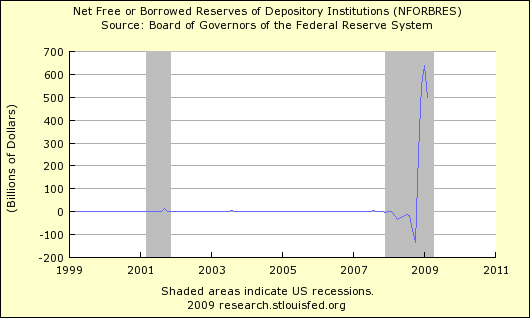
Net Free or Borrowed Reserves (Graph)


Net Free or Borrowed Reserves 403

H.3 Aggregate Reserves of Depository Institutions and the Monetary Base
The series is calculated by the Federal Reserve Bank of St.Louis. Billions of Dollars.

Corporation Net Income Taxes in the United States (Graph)


Corporation Net Income Taxes 403


  • This is the most recent data from the St. Louis Fed and it was just released.
  • There is a lag in the data. Current chart is up to date through January 1, 2008.
  • The numbers in this series are most likely worsening.
  • As you can see, the numbers continued to worsen through the last recession. However, that included the period immediately after 911.
  • Also, this chart is change from previous year, in thousands of dollars. This gives a better picture of the trend of taxes being collected.
State Government Tax Collections, Corporation Net Income Taxes in the United States, Annual, Thousands of Dollars
Subscribe to All American Investor via Email
Bob DeMarco is a citizen journalist and twenty year Wall Street veteran. Bob has written more than 500 articles with more than 11,000 links to his work on the Internet. Content from All American Investor has been syndicated on Reuters, the Wall Street Journal, Fox News, Pluck, Blog Critics, and a growing list of newspaper websites. Bob is actively seeking syndication and writing assignments.

Follow All American Investor on Twitter

Friday, April 03, 2009

Government versus Civilian Employment, Which would you rather be? (graph)


Government employees enjoy a tremendous amount of job security. This is evidenced by the blue line on the chart.

The red line represents civilian employment. The bottom of the red line, current data, shows the loss of 5.1 million jobs.

While government employees often make less, there is an obvious compensating balance.

Government versus Civilian Employment 403
Subscribe to All American Investor via Email
Bob DeMarco is a citizen journalist and twenty year Wall Street veteran. Bob has written more than 500 articles with more than 11,000 links to his work on the Internet. Content from All American Investor has been syndicated on Reuters, the Wall Street Journal, Fox News, Pluck, Blog Critics, and a growing list of newspaper websites. Bob is actively seeking syndication and writing assignments.

Follow All American Investor on Twitter

Civilian Employment Population Ratio (Graph)


This is another way to look at employment. The Ratio has fallen to 59.3 percent of the population. Still not as bad as the double whammy recession of 1980-82.

Of course, the population was lower back in 1980.

Interestingly, this was a period when the parents of the baby boomers where retiring.

Civil Employment Population Ratio 403
Subscribe to All American Investor via Email
Bob DeMarco is a citizen journalist and twenty year Wall Street veteran. Bob has written more than 500 articles with more than 11,000 links to his work on the Internet. Content from All American Investor has been syndicated on Reuters, the Wall Street Journal, Fox News, Pluck, Blog Critics, and a growing list of newspaper websites. Bob is actively seeking syndication and writing assignments.

Follow All American Investor on Twitter

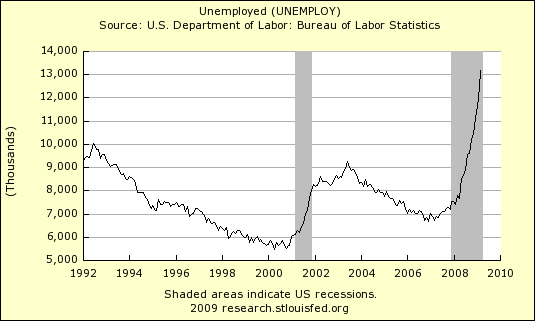
Unemployed (Graph)


Unemployment April

Subscribe to All American Investor via Email

Bob DeMarco is a citizen journalist and twenty year Wall Street veteran. Bob has written more than 500 articles with more than 11,000 links to his work on the Internet. Content from All American Investor has been syndicated on Reuters, the Wall Street Journal, Fox News, Pluck, Blog Critics, and a growing list of newspaper websites. Bob is actively seeking syndication and writing assignments.

5.1 million jobs Lost


Nonfarm payroll employment continued to decline sharply in March (-663,000),
and the unemployment rate rose from 8.1 to 8.5 percent, the Bureau of Labor
Statistics of the U.S. Department of Labor reported today. Since the recession
began in December 2007, 5.1 million jobs have been lost
, with almost two-thirds
(3.3 million) of the decrease occurring in the last 5 months. In March, job
losses were large and widespread across the major industry sectors.
Subscribe to All American Investor via Email
Bob DeMarco is a citizen journalist and twenty year Wall Street veteran. Bob has written more than 500 articles with more than 11,000 links to his work on the Internet. Content from All American Investor has been syndicated on Reuters, the Wall Street Journal, Fox News, Pluck, Blog Critics, and a growing list of newspaper websites. Bob is actively seeking syndication and writing assignments.
Follow All American Investor on Twitter

Tuesday, March 31, 2009

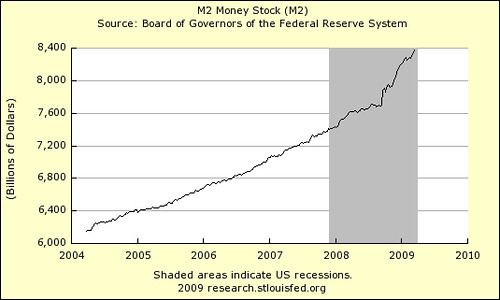
M2, Money Supply Continues to Soar


M2, Money Stock, St Louis Fred Graph, March 27, 2009.

M@ Money Stock 327Align Center


Money Supply as measured by M2 continues to soar. Does anybody really care?

Back in the early 1980s if M2 started rising, the bond vigilantes would have been out in force pushing interest rates higher. Now, not a "peep".

One can only wonder how long it is going to take for this surge in money to take effect. Commodities are at rock bottom as I am writing this.

One thing for sure, if the Fed has acted as it did in the 1930s we would all be eating rocks by now. Potato anyone?

Stay tuned, the fun is going to start very soon.

M2 includes a broader set of financial assets held principally by households. M2 consists of M1 plus:
(1) savings deposits (which include money market deposit accounts, or MMDAs);
(2) small-denomination time deposits (time deposits in amounts of lessthan $100,000);
and (3) balances in retail money market mutual funds(MMMFs).
Seasonally adjusted M2 is computed by summing savings deposits, small-denomination time deposits, and retail MMMFs, each seasonally adjusted separately, and adding this result to seasonally
adjusted M1.
Subscribe to All American Investor via Email