All American Investor
BUILDING PERMITS
Privately-owned housing units authorized by building permits in August were at a seasonally adjusted annual rate of 620,000. This is 3.2 percent (±1.0%) above the revised July rate of 601,000 and is 7.8 percent (±1.4%) above the August 2010 estimate of 575,000.
Single-family authorizations in August were at a rate of 413,000; this is 2.5 percent (±0.9%) above the revised July figure of 403,000.
Authorizations of units in buildings with five units or more were at a rate of 178,000 in August.
Showing posts with label housing starts. Show all posts
Showing posts with label housing starts. Show all posts
Tuesday, September 20, 2011


Sunday, August 21, 2011
Housing Starts: New Privately Owned Housing Units Started (Chart, 8-19)
Privately owned housing starts in July were at a seasonally adjusted annual rate of 604,000.
By Bob DeMarco
All American Investor
This is 1.5 percent (±10.7%) below the revised June estimate of 613,000, but is 9.8 percent (±10.8%)* above the July 2010 rate of 550,000.
Single-family housing starts in July were at a rate of 425,000; this is 4.9 percent (±8.9%)* below the revised June figure of 447,000.
The July rate for units in buildings with five units or more was 170,000
Tuesday, July 20, 2010
Housing Starts New Privately Owned Housing Units Started (Graph)
549,000 housing starts versus 578,00 a month ago, 679,00 two months ago, and 583,000 a year ago.
The most recent housing peak occurred during June, 2006 with starts at 2,273,00.
The most recent housing peak occurred during June, 2006 with starts at 2,273,00.
Wednesday, June 16, 2010
Housing Starts New Privately Owned Housing Units Started (Graph)

593,000 versus 659,000 a month ago. Down 66,000.
Tuesday, June 16, 2009
Housing Starts Graph and Statistics
Housing Starts

The U.S. Census Bureau and the Department of Housing and Urban Development jointly announced the following new residential construction statistics for May 2009.
BUILDING PERMITS
HOUSING STARTS
More from All American Investor
 Kindle: Amazon's 6" Wireless Reading Device
Follow All American Investor on Twitter
Subscribe to All American Investor via Email
The U.S. Census Bureau and the Department of Housing and Urban Development jointly announced the following new residential construction statistics for May 2009.
BUILDING PERMITS
- Privately-owned housing units authorized by building permits in May were at a seasonally adjusted annual rate of 518,000.
- This is 4.0 percent above the revised April rate of 498,000, but is 47.0 percent below the May 2008 estimate of 978,000.
- Single-family authorizations in May were at a rate of 408,000; this is 7.9 percent above the revised April figure of 378,000.
HOUSING STARTS
- Privately-owned housing starts in May were at a seasonally adjusted annual rate of 532,000.
- This is 17.2 percent above the revised April estimate of 454,000, but is 45.2 percent below the May 2008 rate of 971,000.
- Single-family housing starts in May were at a rate of 401,000; this is 7.5 percent above the revised April figure of 373,000.
- The May rate for units in buildings with five units or more was 124,000.
- Privately-owned housing completions in May were at a seasonally adjusted annual rate of 811,000. This is 3.3 percent.
- below the revised April estimate of 839,000 and is 28.8 percent below the May 2008 rate of 1,139,000.
- Single-family housing completions in May were at a rate of 491,000; this is 9.4 percent below the revised April figure of 542,000.
- The May rate for units in buildings with five units or more was 314,000.
 Bob DeMarco is a citizen journalist and twenty year Wall Street veteran. Bob has written more than 500 articles with more than 11,000 links to his work on the Internet. Content from All American Investor has been syndicated on Reuters, the Wall Street Journal, Fox News, Pluck, Blog Critics, and a growing list of newspaper websites. Bob is actively seeking syndication and writing assignments. Bob DeMarco is a citizen journalist and twenty year Wall Street veteran. Bob has written more than 500 articles with more than 11,000 links to his work on the Internet. Content from All American Investor has been syndicated on Reuters, the Wall Street Journal, Fox News, Pluck, Blog Critics, and a growing list of newspaper websites. Bob is actively seeking syndication and writing assignments. |
More from All American Investor
- Bond Vigilantes Take over in the Long End (Graph)
- Ten Year Treasury Yield in Orbit (Graph)
- Ten Year Interest Rates Rising (Chart)
- Option ARM--The Toxic Mortgage
- Systemic Risk Defined--Too Big to Fail
- Ray Dalio on the current state of affairs in the market
- Roubini Predicts U.S. Losses May Reach $3.6 Trillion
- 60 Minutes -- Cold Fusion
Kindle: Amazon's 6" Wireless Reading Device Follow All American Investor on Twitter
Thursday, April 16, 2009
Housing Starts Like a Bullet Hitting Water (Chart)
Housing Starts New Residential Construction
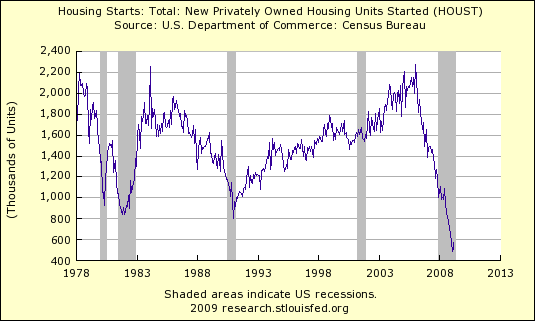
Privately-owned housing starts in March were at a seasonally adjusted annual rate of 510,000. This is 10.8 percent (±11.6%)* below the revised February estimate of 572,000 and is 48.4 percent (±5.9%) below the March 2008 rate of 988,000. Single-family housing starts in March were at a rate of 358,000; this is unchanged (±16.2%)* from the revised February figure of
358,000. The March rate for units in buildings with five units or more was 116,000.
Source: Census.gov
Privately-owned housing starts in March were at a seasonally adjusted annual rate of 510,000. This is 10.8 percent (±11.6%)* below the revised February estimate of 572,000 and is 48.4 percent (±5.9%) below the March 2008 rate of 988,000. Single-family housing starts in March were at a rate of 358,000; this is unchanged (±16.2%)* from the revised February figure of
358,000. The March rate for units in buildings with five units or more was 116,000.
Source: Census.gov
Subscribe to All American Investor via Email
Kindle 2: Amazon's New Wireless Reading Device (Latest Generation)
Follow All American Investor on Twitter

Subscribe to:
Posts (Atom)