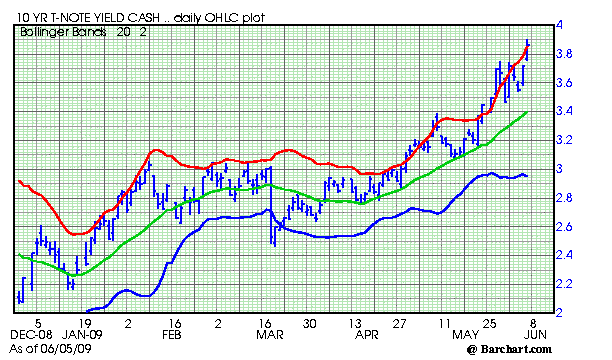
Our new song is, there ain't no stopping it now. Oh, the Treasury will come in and buy some size in longer dated Treasuries and mortgage back securities, forcing a short lived, temporary drop in rates from time to time.
As you can see if you look at the red line on the chart, this market continues to stay overbought. This is not a negative sign, quite the opposite, it signals the enormous strength of this trend up in interest rates.
Expect the Fed to defend the 4.00% with both hands and both feet. It will be interesting to see if they can stem the tide of rising interest rates in the longer end of the market.
This rise in ten year interest rates has lots of negative implications. However, the single biggest negative is simple --the refinancing boom is over. With mortgage rates well over 5 percent now, the economics won't work for the vast number of mortgage owners that refinanced in prior drops into the current area.
More from All American Investor
 Kindle: Amazon's 6" Wireless Reading Device
Subscribe to All American Investor via Email
 Bob DeMarco is a citizen journalist and twenty year Wall Street veteran. Bob has written more than 500 articles with more than 11,000 links to his work on the Internet. Content from All American Investor has been syndicated on Reuters, the Wall Street Journal, Fox News, Pluck, Blog Critics, and a growing list of newspaper websites. Bob is actively seeking syndication and writing assignments. Bob DeMarco is a citizen journalist and twenty year Wall Street veteran. Bob has written more than 500 articles with more than 11,000 links to his work on the Internet. Content from All American Investor has been syndicated on Reuters, the Wall Street Journal, Fox News, Pluck, Blog Critics, and a growing list of newspaper websites. Bob is actively seeking syndication and writing assignments. |
More from All American Investor
- Ten Year Treasury Yield in Orbit (Graph)
- Ten Year Interest Rates Rising (Chart)
- Systemic Risk Defined--Too Big to Fail
- Ray Dalio on the current state of affairs in the market
- Roubini Predicts U.S. Losses May Reach $3.6 Trillion
- Option ARM--The Toxic Mortgage
- 60 Minutes -- Cold Fusion
 Kindle: Amazon's 6" Wireless Reading Device
No comments:
Post a Comment