Showing posts with label graph. Show all posts

Sunday, June 30, 2013

Money Supply, M2, 10,594.2 Billions of Dollars


Current M2 10,594.2 Billions of Dollars, versus 9912.1 Billions of Dollars one year ago, and 5962.3 Billions of Dollars ten years ago.


Updated: 2013-06-28

Saturday, June 08, 2013

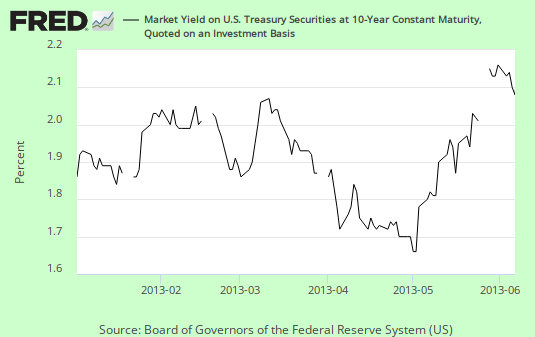
Ten Year Treasury January to Now Chart


10-Year Treasury Constant Maturity Rate (DGS10)

2.08 Percent

FRED Graph

Last Five Observations

2013-06-06: 2.08 Percent
2013-06-05: 2.10
2013-06-04: 2.14
2013-06-03: 2.13
2013-05-31: 2.16

Original content +Bob DeMarco , All American Investor

Monday, June 03, 2013

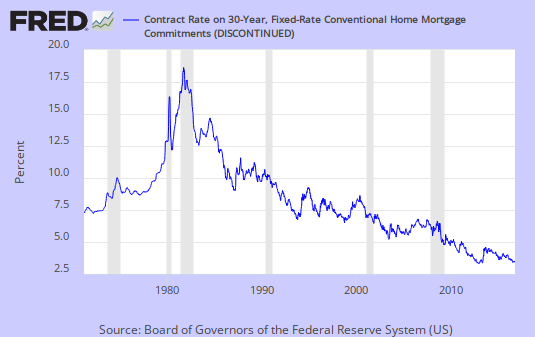
30-Year Conventional Mortgage Rate 5 30 2012


3.81 Percent

FRED Graph

Contract interest rates on commitments for fixed-rate first mortgages. Source: Primary Mortgage Market Survey data provided by Freddie Mac.

Original content +Bob DeMarco, All American Investor

Sunday, June 02, 2013

M2 Money Stock (M2) 5 20 2013


M2 includes a broader set of financial assets held principally by households.

M2 consists of M1 plus: 

(1) savings deposits (which include money market deposit accounts, or MMDAs); 
(2) small-denomination time deposits (time deposits in amounts of less than $100,000); and 
(3) balances in retail money market mutual funds (MMMFs). 

Seasonally adjusted M2 is computed by summing savings deposits, small-denomination time deposits, and retail MMMFs, each seasonally adjusted separately, and adding this result to seasonally adjusted M1.

10,541.5 Billions of Dollars

FRED Graph

Original content +Bob DeMarco , All American Investor


Tuesday, May 28, 2013

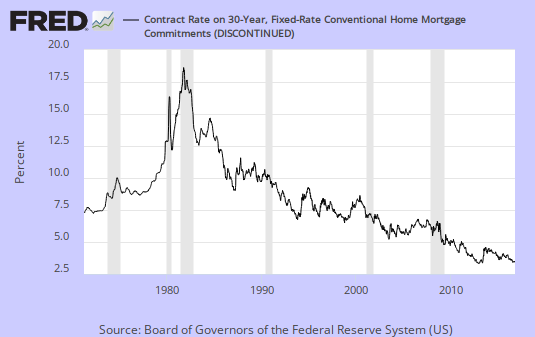
30-Year Conventional Mortgage Rate 2013-05-23


3.59 Percent

Graph of 30-Year Conventional Mortgage Rate

Source: Primary Mortgage Market Survey data provided by Freddie Mac.

Original content +Bob DeMarco , All American Investor

Saturday, May 25, 2013

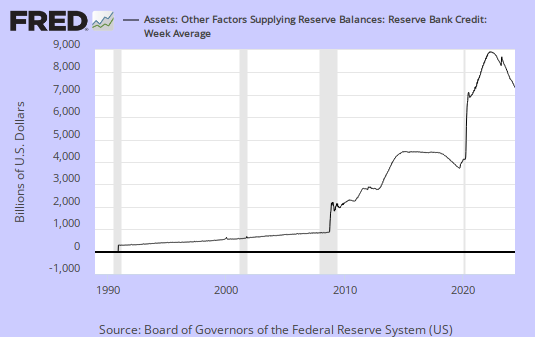
Reserve Bank Credit 2013-05-22


3,336.659 Billions of Dollars

Graph of Reserve Bank Credit

Wednesday, January 16, 2013

Industrial Production Index Jan 2013


All American Investor

2012-12: 98.0930 Index 2007=100

Industrial Production Index Jan 2013

Sunday, January 06, 2013

Reserve Bank Credit 12013


All American Investor

2,896.291 Billions of Dollars
Updated: 2013-01-04 12:01 PM CST

FRED Graph

If you don't see the chart - go here.

Saturday, January 05, 2013

Civilian Unemployment Rate 104


The unemployment rate represents the number of unemployed as a percentage of the labor force.


2012-12: 7.8 Percent 

Monthly, Seasonally Adjusted, Updated: 2013-01-04

FRED Graph

If you don't see the chart go here

Tuesday, January 01, 2013

30-Year Conventional Mortgage Rate 1231


FRED Graph

Contract interest rates on commitments for fixed-rate first mortgages. Source: Primary Mortgage Market Survey data provided by Freddie Mac. Please refer to the series WMORTG for historical data. 
pdated: 2012-12-31 3:01 PM CST

Sunday, August 19, 2012

Mastercard (MA) 2012 Review


Mastercard (MA) is a global leader in electronic payments serving as a processor, franchisor and advisor to approximately 25,000 financial institutions for their credit, debit and other payment programs. 

Mastercard (MA) 2012 Review
In addition, it manages a family of payment card brands (Mastercard, Mastercard Electronic, Maestro, Cirrus). Importantly, MA does not extend credit; it simply acts as a toll collector and is paid on both transaction volume and dollar volume.

The company earns in excess of a 25% return on equity and has grown profits from $1.76 in 2004 to $18.70 in 2011 and its dividend from $.09 in 2006 to $.60 in 2011.

While the 2008-2009 pullback in global consumer spending impacted the gross dollar volume of transactions, the company continued to grow; further improvement should come as a result of:

Monday, August 06, 2012

Kimberly Clark (KMB) 2012 Review


Kimberly Clark develops, manufactures and markets personal care products (Huggies, Pull Ups, Little Swimmers, Goodnights, Kotex, Depends, Kleenex, Scott, Cottonelle tissue and Viva paper towels).

KMB has grown its profits and dividends at a 4-9% annual rate over the past 10 years earning an amazing 30%+ rate of return on equity. As with many of our companies, Kimberly has had a rough go of it in the last five years as customers ‘traded down’ to generic brands. However, the company is seeing improvement in its bottom line which should continue as a result of:

(1) significant cost cutting as well as better supply chain management,

(2) expansion into emerging markets,

(3) new product innovation,

(4) a significant stock buy back program,

Negatives:

(1) volatile commodity prices,

(2) currency fluctuations.

KMB is rated A++ by Value Line, carries a 51% debt to equity ratio and its stock yields 4.0%

Statistical Summary

Stock Yield Dividend Growth Rate Payout Ratio # Increases Since 2002
KMB 4.0% 4% 64% 10
IND 2.5 11 40 NA

Debt/Equity ROE EPS Down Since 2002 Net Margin Value Line Rating
KMB 51% 33% 3 8% A++
IND 36 20 NA 13 NA


Chart

Note: KMB stock made great progress off its March 2009 low, surpassing the downtrend off its June 2007 high (red line) and the November 2008 trading high (green line). Long term, the stock is in an uptrend (straight blue lines). Intermediate term, it is in an uptrend (purple lines). Short term it is in an uptrend (brown line). The High Yield Portfolio owns a 75% position in KMB. The upper boundary of its Buy Value Range is $51. The lower boundary of its Sell Half Range is $87.


http://finance.yahoo.com/q?s=KMB


Steve Cook received his education in investments from Harvard, where he earned an MBA, New York University, where he did post graduate work in economics and financial analysis and the CFA Institute, where he earned the Chartered Financial Analysts designation in 1973. His 40 years of investment experience includes institutional portfolio management at Scudder, Stevens and Clark and Bear Stearns. Steve's goal at Strategic Stock Investments is to help other investors build wealth and benefit from the investing lessons he learned the hard way.

Thursday, July 19, 2012

Tiffany (TIF) 2012 Review


Tiffany & Co (TIF) is an internationally known retailer, designer and manufacturer of fine jewelry, silverware, china, crystal and gift items.

The company has grown profits and dividends at a 10-20% rate over the last 10 years earning a 14-19% return on equity. 2009 was a difficult year for TIF, made especially so by management’s hesitancy to discount and the decline in spending by foreign tourists. However, 2010 rebounded strongly and profits have continued to grow as a result of:

(1) rising sales made possible by rising capital expenditures in its distribution, manufacturing and diamond sourcing process,

(2) increased penetration in international markets,

(3) expansion in new store openings,

(4) a growing customer base resulting from opening a line of new smaller stores with lower priced, higher margin products,

(5) stock buyback program.

Thursday, June 14, 2012

Automatic Data Processing (ADP) 2012 Review


Automatic Data Processing (ADP) provides payroll and tax filing services, brokerage services, comprehensive human resource services and financial services to auto and truck dealerships.

The company has grown profits and dividends 7-14% over the last 10 years and has earned an 18-20% return on equity. While the 2008-2009 recession impacted ADP somewhat, it did very well relative to other companies. Long term, the company should continue to prosper based:

(1) the economic recovery has led to an increase in both customers and the number of checks processed,

(2) the contribution from the recent acquisitions [8 in the last year],

(3) a dedicated effort to technological upgrades,

(4) its stock buy back program.

Wednesday, April 18, 2012

Occidental Petroleum (OXY)


Occidental Petroleum (OXY) produces and markets crude oil and natural gas, manufactures industrial chemicals, plastics and fertilizer and transports natural gas through pipelines.

The company has grown profits at a 24% over the last ten years. Dividends grew at a lesser rate (10%) though they are expected to rise to an 11% pace. OXY’s return on equity has been in the 11-20% range. The company should continue to grow dividends and earnings as a result of:

(1) rising production from new properties,

(2) the company’s expertise in enhanced oil recovery techniques,

(3) acquisitions,

(4) resumption of operations in Libya,

(5) improving profit margins,

(6) stock buyback program.

Friday, April 06, 2012

Target (TGT) 2012 Review


Target (TGT) is a leading discount retailer concentrated in California, Texas, Florida and the upper Midwest. It has grown profits and dividends at an 11-14% pace over the last 10 years earning a 15%+ return on equity. 

The company faltered a bit in its 2008 fiscal year due to the slowing economy but has since recovered and should continue growing at an above average rate as a result of:

(1) improving comparable store sales and operating margins due to its product innovation, aggressive pricing strategy and its efficient, multi channel marketing strategy,

(2) rising store productivity arising from expanded grocery offering, better store layout and an enhanced in-store shopping experience,

(3) introduction of smaller stores in urban markets,

(4) expansion internationally.

(5) active stock buyback program.

Thursday, April 05, 2012

Xilinx (XLNX) 2012 Review


Xilinx designs, develops and markets complementary metal-oxide-silicon programmable logic devices, including field programmable gate arrays and complex programmable logic devices and markets hardware devices and develops software design tools for programmable electronic technologies.

Steve Cook
The company has grown profits at a 10% pace over the last 10 years and has raised its dividend per share from $.20 in 2004 to $.64 in 2010. Return on equity has come in between 16% and 20% in the last five years. XLNX experienced a hiccup in 2009 due to the recession but recovered in 2010 year and should continue to make progress as a result of:

(1) benefiting from the global trend of programmable logic devices replacing application-specific integrated circuits,

(2) improvement in demand from its two principal markets,

(3) new products expected to open new markets,

Wednesday, April 04, 2012

Family Dollar Stores (FDO) 2012 Review


Family Dollar Stores operates a chain of 6,785 general retail discount merchandise stores in 44 states. It provides competitively priced goods to low and middle income consumers, including home products, apparel and accessories, seasonal goods and electronics. 

FDO has grown profits and dividends at an 11% pace over the last 10 years earning a 15-20% return on equity. The company successfully navigated its way through the recent recession and should continue to improve earnings as a result of:

(1) its strategy to upgrade its merchandising, marketing and store operations,

(2) aggressive price management and cost containment programs,

Sunday, March 11, 2012

All Employees: Government 311 (Graph)


All American Investor


Reserve Bank Credit 311


Reserve Bank credit is the sum of securities held outright, repurchase agreements, term auction credit, other loans, net portfolio holdings of Commercial Paper Funding Facility LLC, net portfolio holdings of LLCs funded through the Money Market Investor Funding Facility, net portfolio holdings of Maiden Lane LLC, net portfolio holdings of Maiden Lane II LLC, net portfolio holdings of Maiden Lane III LLC, float, central bank liquidity swaps, and other Federal Reserve assets.

All American Investor