Showing posts with label dividend. Show all posts

Thursday, September 13, 2012

Total System Services (TSS) 2012 Review


Total System Services, TSS, is a major processor of credit, debit and private label card transactions for institutions in North America.

TSS has grown dividends and profits at a 10-20% annual pace for the past 10 years earning a 15-20% return on equity. Despite a drop in revenue resulting from a tightening of consumer purse strings in the recent recession, management has structured a return to above average growth by:

(1) an improving economy leads to an increase in cardholder transactions,

(2) acquisitions [the company has a strong cash position],

(3) ongoing share buyback program,

(4) streamlining its operations and aggressive cost cutting.

Negatives:

(1) TSS is in a highly competitive industry,

(2) falling interest rates have a negative impact on income,

(3) new regulations may slower growth in cardholder accounts and higher operating costs.

Total is rated B++ by Value Line, carries a 4% debt to equity ratio and its stock yields 1.7%.

Statistical Summary

Stock Yield Dividend Growth Rate Payout Ratio # Increases Since 2002
TSS 1.7% 6% 28% 6
IND 2.0 9 26 NA


Debt/Equity ROE EPS Down Since 2002 Net Margin Value Line Rating
TSS 4% 18% 3 13% B++
IND 31 21 NA 17 NA


Chart

Note: TSS stock has made steady progress off its November 2008 low, surpassing the down trend off its May 2007 high (straight red line) and the November trading high (green line). TSS is in a long term trading range; the blue line is the lower boundary. However, it is an intermediate term up trend (purple lines). The wiggly red line is the 50 day moving average. The Dividend Growth Portfolio owns a 50% position in TSS. Shares would be Added at $12. The lower boundary of its Sell Half Range is $28.


http://finance.yahoo.com/q?s=TSS


Steve Cook received his education in investments from Harvard, where he earned an MBA, New York University, where he did post graduate work in economics and financial analysis and the CFA Institute, where he earned the Chartered Financial Analysts designation in 1973. His 40 years of investment experience includes institutional portfolio management at Scudder, Stevens and Clark and Bear Stearns. Steve's goal at Strategic Stock Investments is to help other investors build wealth and benefit from the investing lessons he learned the hard way.

Wednesday, September 12, 2012

T Rowe Price (TROW) 2012 Review


T. Rowe Price Group Inc, TROW, provides investment advisory and administrative services to an assortment of no load funds, sponsored investment products and private accounts.

T Rowe Price has generated a 18-20%+ return on equity and a 10-15% growth rate in earnings and dividends over the 10 years. 

While TROW suffered a decline in assets under management due primarily to the late 2008-early 2009 decline in stock prices, a recovery occurred in 2010 and should continue as a result of:

(1) the excellent track record of its funds as well as recent investor optimism has increased the value of current assets under management as well as attracting new customers,

(2) the introduction of new products such as country funds,

(3) an aggressive cost cutting program.

VF Corp (VFC) 2012 Review


VF Corporation, VFC,  is an apparel maker and distributor and a leader in jeans wear, sportswear, image wear and work wear. It has raised its dividend every year for the last 20 years.

Its brands include Lee, Wrangler, Jansport, Nautica, The North Face, Vans, Napaplin, Timberland, John Varvatos and Reef. The company has grown its profits and dividend at a 9-11% rate over the last 10 years earning a 15-18% return on equity.

It has raised its dividend every year for the last 20 years. Despite tough conditions in many of its product categories in 2009, management negotiated this period with barely a hiccup and set the company on a course to continue to grow earnings by:

(1) the strength of VFC’s brand management strategy provides a competitive advantage with regard to distribution as well as benefiting it tough economic periods,

(2) its long history of manufacturing and engineering expertise produces cost and service benefits,

(3) a successful acquisition program focusing on companies with global growth opportunities. The recent acquisitions of [a] Timberland will spur growth in its outdoor and sportswear businesses and [b] Rock and Republic Enterprises will increase its competitive position in premium jeans.

Tuesday, September 11, 2012

Reliance Steel (RS) 2012 Review


Reliance Steel, RS,  provides value-added metals processing services and distributes more than 100,000 metal products. 

The company has grown profits and dividends at a 13-15% rate and earned a 7-19% return on equity over the last ten years. RS operations were under significant pressure from declining volume and increasing price competition in 2009. However, profits begun growing again as a result of:

(1) despite slow economic growth, it is witnessing improvement in its core customer base (aerospace and energy) resulting in both rising demand and prices,

(2) acquisitions (latest: McKey and National Specialty Alloys),

(3) an excellent cost control discipline.


Marathon Oil (MRO) 2012 Review


Marathon Oil , MRO,  is an oil and natural gas production company, having recently spun off its refining operations. 

As a newly separated entity, it has no available historical data. However, future profit and dividend increases are expected in the 8-13% range and ROE is estimated in the 12-15% area. Looking ahead both earnings and dividends will be driven by:

(1) expanding activity in Texas’ Eagle Ford shale,

(2) acquisitions,

(3) strong inventory of development projects [Indonesia, Iraq, Poland].

Monday, September 10, 2012

General Mills (GIS) 2012 Review


General Mills Inc., GIS, processes and markets such well known products as Cheerios, Wheaties, Total, Chex, Betty Crocker, Bisquick, Hamburger Helper, Yoplait and Progresso. 

The company has grown profits and dividends at a 7-10% pace over the last ten years earning a 20%+ return on equity. This performance should continue as a result of:

(1) an outstanding portfolio of fast growing brands

(2) a steady pipeline of new products which enhance sales and take market share,

(3) an aggressive cost cutting program,

(4) expansion into emerging markets which should account for 70% of food growth though 2012,

(5) acquisitions (latest: Yoplait Int’l, Parampara Foods [India], Yoki [Brazil])

(6) management is committed to enhancing shareholder value via increasing dividends and share buy backs.


Sun Hydraulics (SNHY) 2012 Review


Sun Hydraulics, SNHY,  designs, manufactures and markets valves and manifolds for hydraulic systems including electrical and nonelectrical actuated valves, machined manifolds and custom valve and manifold assemblies for use in construction agriculture, mining, industrial and fire and rescue equipment. 

The company has grown dividends and profits at a 10-18% pace over the past five years earning a 15-20% return on equity. SHNY’s business suffered dramatically in the 2009 recession; however, it has made a strong comeback which should continue as a result of:

(1) growth in global industrial capital expenditures,

(2) price increases,

(3) exposure to Germany, Korea, China and India.

Monday, August 06, 2012

Kimberly Clark (KMB) 2012 Review


Kimberly Clark develops, manufactures and markets personal care products (Huggies, Pull Ups, Little Swimmers, Goodnights, Kotex, Depends, Kleenex, Scott, Cottonelle tissue and Viva paper towels).

KMB has grown its profits and dividends at a 4-9% annual rate over the past 10 years earning an amazing 30%+ rate of return on equity. As with many of our companies, Kimberly has had a rough go of it in the last five years as customers ‘traded down’ to generic brands. However, the company is seeing improvement in its bottom line which should continue as a result of:

(1) significant cost cutting as well as better supply chain management,

(2) expansion into emerging markets,

(3) new product innovation,

(4) a significant stock buy back program,

Negatives:

(1) volatile commodity prices,

(2) currency fluctuations.

KMB is rated A++ by Value Line, carries a 51% debt to equity ratio and its stock yields 4.0%

Statistical Summary

Stock Yield Dividend Growth Rate Payout Ratio # Increases Since 2002
KMB 4.0% 4% 64% 10
IND 2.5 11 40 NA

Debt/Equity ROE EPS Down Since 2002 Net Margin Value Line Rating
KMB 51% 33% 3 8% A++
IND 36 20 NA 13 NA


Chart

Note: KMB stock made great progress off its March 2009 low, surpassing the downtrend off its June 2007 high (red line) and the November 2008 trading high (green line). Long term, the stock is in an uptrend (straight blue lines). Intermediate term, it is in an uptrend (purple lines). Short term it is in an uptrend (brown line). The High Yield Portfolio owns a 75% position in KMB. The upper boundary of its Buy Value Range is $51. The lower boundary of its Sell Half Range is $87.


http://finance.yahoo.com/q?s=KMB


Steve Cook received his education in investments from Harvard, where he earned an MBA, New York University, where he did post graduate work in economics and financial analysis and the CFA Institute, where he earned the Chartered Financial Analysts designation in 1973. His 40 years of investment experience includes institutional portfolio management at Scudder, Stevens and Clark and Bear Stearns. Steve's goal at Strategic Stock Investments is to help other investors build wealth and benefit from the investing lessons he learned the hard way.
Thursday, March 08, 2012

Ross Stores (ROST) 2012 Review


Ross Stores (ROST) operates a chain of off price retail stores offering high quality, in season name brand and designer apparel, shoes, cosmetics, accessories and home merchandise at discounts of 20-60% below mainstream retailers.

The company has grown profits and dividends at a 15-20% annual rate over the past 10 years, earning a 25%+ return on equity. While current retail environment experienced difficulties in the recent recession, ROST’s off price business model continued to produce above average results because:

Thursday, September 15, 2011

Buy Sigma Aldrich (SIAL, Dividend and Aggressive Growth Portfolios)


Sigma-Aldrich Corp (SIAL) develops, manufactures and distributes a wide assortment (173,000 products) of biochemicals, organic chemicals, chromatography products and diagnostic reagents in over 166 countries. The company has grown earnings and dividends at a 13-14% annual rate over the last 10 years while earning approximately 20% on its capital. SIAL should be able to continue this performance because:

(1) increased market penetration in emerging markets as well as with major drug companies, research establishments and universities,

(2) new product introductions in analytical, biology and materials sciences,

(3) acquisitions [Cerillant Corp, Resource Technology Corp., Vetec Quimica Fina Lida of Brazil,

(4) an aggressive cost controls through supply chain initiatives and SG&A management,

(5) an ongoing stock buyback program.

The primary negative for the company is its exposure to currency fluctuations.

SIAL is rated A by Value Line, has a 12% debt to equity ratio and its stock yields 1.0%.


Sunday, April 26, 2009

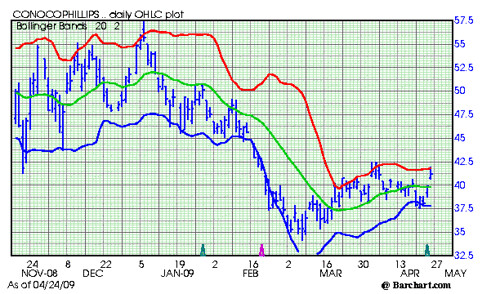
Conoco Phillips (COP) great yield, great chart


Conoco Phillips (Cop) yields 4.60 percent. The chart looks good and a close over 42.50 would confirm the change in trend. The stock traded near 57.50 on January 9. I started thinking about this stocks after hearing Jim Cramer tout it on Mad Money.

Conoco Phillips 426


Subscribe to All American Investor via Email


Bob DeMarco is a citizen journalist and twenty year Wall Street veteran. Bob has written more than 500 articles with more than 11,000 links to his work on the Internet. Content from All American Investor has been syndicated on Reuters, the Wall Street Journal, Fox News, Pluck, Blog Critics, and a growing list of newspaper websites. Bob is actively seeking syndication and writing assignments.


More from All American Investor


Follow All American Investor on Twitter

Wednesday, February 25, 2009

Dividend to Earnings Payout Ratio--Chart


This chart is a little disconcerting. On the other hand it is rapidly approaching the area we saw in 1982--the last major low in the market. File this one under food for thought. Feel free to comment or interpret.


Click on the chart for a better view.

Thanks to the Big Picture.