Showing posts with label money stock. Show all posts

Sunday, June 30, 2013

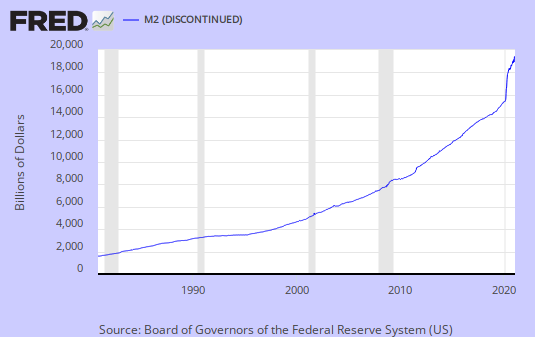
Money Supply, M2, 10,594.2 Billions of Dollars


Current M2 10,594.2 Billions of Dollars, versus 9912.1 Billions of Dollars one year ago, and 5962.3 Billions of Dollars ten years ago.


Updated: 2013-06-28

Sunday, June 23, 2013

Money Supply, M2, Billions of Dollars, 6-10-13


10,590.2 Billions of Dollars

Graph of M2 Money Stock

M2 includes a broader set of financial assets held principally by households. M2 consists of M1 plus: (1) savings deposits (which include money market deposit accounts, or MMDAs); (2) small-denomination time deposits (time deposits in amounts of less than $100,000); and (3) balances in retail money market mutual funds (MMMFs). Seasonally adjusted M2 is computed by summing savings deposits, small-denomination time deposits, and retail MMMFs, each seasonally adjusted separately, and adding this result to seasonally adjusted M1.

Original content +Bob DeMarco , All American Investor

Saturday, June 08, 2013

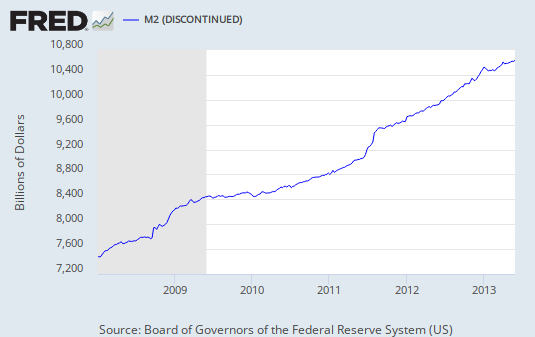
M2, Money Supply, 2008 to the Present Chart


M2 Money Stock (M2)

10,557.6 Billions of Dollars

FRED Graph


M2 includes a broader set of financial assets held principally by households. M2 consists of M1 plus: (1) savings deposits (which include money market deposit accounts, or MMDAs); (2) small-denomination time deposits (time deposits in amounts of less than $100,000); and (3) balances in retail money market mutual funds (MMMFs). Seasonally adjusted M2 is computed by summing savings deposits, small-denomination time deposits, and retail MMMFs, each seasonally adjusted separately, and adding this result to seasonally adjusted M1.

Original content Bob DeMarco, All American Investor

Sunday, June 02, 2013

M2 Money Stock (M2) 5 20 2013


M2 includes a broader set of financial assets held principally by households.

M2 consists of M1 plus: 

(1) savings deposits (which include money market deposit accounts, or MMDAs); 
(2) small-denomination time deposits (time deposits in amounts of less than $100,000); and 
(3) balances in retail money market mutual funds (MMMFs). 

Seasonally adjusted M2 is computed by summing savings deposits, small-denomination time deposits, and retail MMMFs, each seasonally adjusted separately, and adding this result to seasonally adjusted M1.

10,541.5 Billions of Dollars

FRED Graph

Original content +Bob DeMarco , All American Investor


Saturday, May 25, 2013

M2 Money Stock 2013-05-13


M2 Money Stock (M2)

2013-05-13: 10,553.4 Billions of Dollars


Graph of M2 Money Stock

Source http://research.stlouisfed.org/fred2/series/M2

Original content +Bob DeMarco , All American Investor

Saturday, December 29, 2012

M2 Money Supply (M2) 1217


FRED Graph


Notes: 

M2 includes a broader set of financial assets held principally by households. M2 consists of M1 plus: (1) savings deposits (which include money market deposit accounts, or MMDAs); (2) small-denomination time deposits (time deposits in amounts of less than $100,000); and (3) balances in retail money market mutual funds (MMMFs). Seasonally adjusted M2 is computed by summing savings deposits, small-denomination time deposits, and retail MMMFs, each seasonally adjusted separately, and adding this result to seasonally adjusted M1.

Sunday, February 26, 2012

M2 Money Stock (M2 Graph)


All American Investor


Sunday, July 25, 2010

Money Supply, M2, Comparison Chart


M2 includes a broader set of financial assets held principally by households. M2 consists of M1 plus: (1) savings deposits (which include money market deposit accounts, or MMDAs); (2) small-denomination time deposits (time deposits in amounts of less than $100,000); and (3) balances in retail money market mutual funds (MMMFs). Seasonally adjusted M2 is computed by summing savings deposits, small-denomination time deposits, and retail MMMFs, each seasonally adjusted separately, and adding this result to seasonally adjusted M1.

Friday, June 25, 2010

M2 Money Stock (Chart)


Subscribe to All American Investor
Enter Your Email Address

Saturday, May 23, 2009

Fed Series M2, Money Supply Still Soaring (Chart)


Fed Data, M2, Money Stock, Chart


We wrote several months ago about how it takes 12-18 months for increases in money supply to effect interest rates and commodity prices. We are now in this window.

The dramatic increases in money supply, the Fed balance sheet, and the drop in the dollar are starting to weigh on investor confidence.

Stocks rarely rise when confidence dwindles. It now seems we are moving from what was growing confidence in the markets to growing uncertainty.

The risk of owning equities on a short term basis not outweighs the reward. The threat of rising interest rates has also risen dramatically. This weeks surge in Gold is another barometer of investor confidence.
Subscribe to All American Investor via Email

Bob DeMarco is a citizen journalist and twenty year Wall Street veteran. Bob has written more than 500 articles with more than 11,000 links to his work on the Internet. Content from All American Investor has been syndicated on Reuters, the Wall Street Journal, Fox News, Pluck, Blog Critics, and a growing list of newspaper websites. Bob is actively seeking syndication and writing assignments.Bob DeMarco, All American Investor, May 2009

Kindle: Amazon's Wireless Reading Device (Latest Generation)


Follow All American Investor on Twitter

Friday, January 16, 2009

M2 Money Stock