
Showing posts with label mortgage. Show all posts
Showing posts with label mortgage. Show all posts
Tuesday, July 30, 2013
Monday, June 03, 2013
30-Year Conventional Mortgage Rate 5 30 2012
3.81 Percent
Contract interest rates on commitments for fixed-rate first mortgages. Source: Primary Mortgage Market Survey data provided by Freddie Mac.
Original content +Bob DeMarco, All American Investor
Tuesday, January 01, 2013
30-Year Conventional Mortgage Rate 1231
Contract interest rates on commitments for fixed-rate first mortgages. Source: Primary Mortgage Market Survey data provided by Freddie Mac. Please refer to the series WMORTG for historical data.
pdated: 2012-12-31 3:01 PM CST
Wednesday, June 30, 2010
Wednesday, July 22, 2009
Mortgage Interest Rates and Applications Increase
- The average contract interest rate for 30-year fixed-rate mortgages increased to 5.31 percent from 5.05 percent, with points increasing to 1.18 from 1.12 (including the origination fee) for 80 percent loan-to-value (LTV) ratio loans.
- The Market Composite Index, a measure of mortgage loan application volume, was 528.9, an increase of 2.8 percent on a seasonally adjusted basis from 514.4 one week earlier.
- The Refinance Index increased 4.0 percent to 2089.7 from 2009.4 the previous week.
Subscribe to All American Investor via Email
 Wireless Reading Device
 Saturday, July 18, 2009
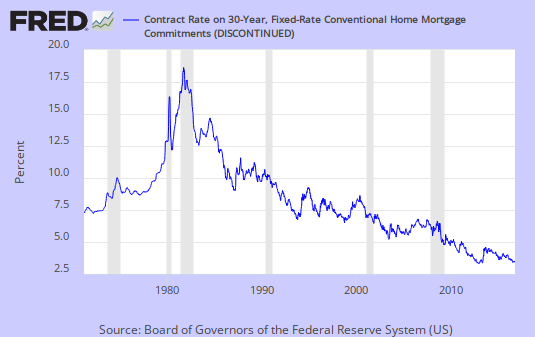
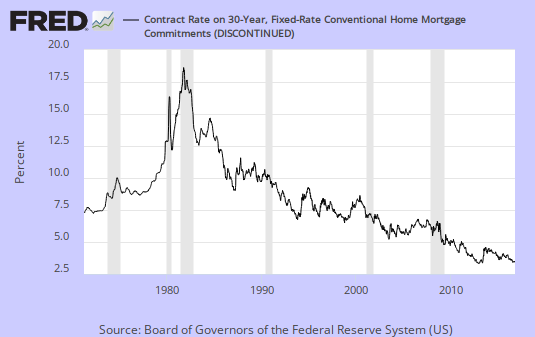
30 Year Mortgage Interest Rate (Conventional, Graph)
Subscribe to All American Investor via Email
Latest from the St Louis Fed and Federal Reserve
 Wireless Reading Device
 Wednesday, June 24, 2009
Mortgage Applications Survey and Interest Rates 624
The Mortgage Bankers Association (MBA) today released its Weekly Mortgage Applications Survey for the week ending June 19, 2009. The Market Composite Index, a measure of mortgage loan application volume, was 548.2, an increase of 6.6 percent on a seasonally adjusted basis from 514.4 one week earlier.
The four week moving average for the seasonally adjusted Market Index is down 9.3 percent.
The Refinance Index increased 5.9 percent to 2116.3 from 1998.1 the previous week and the seasonally adjusted Purchase Index increased 7.3 percent to 280.3 from 261.2 one week earlier.
The average contract interest rate for 30-year fixed-rate mortgages decreased to 5.44 percent from 5.50 percent, with points increasing to 0.99 from 0.89 (including the origination fee) for 80 percent loan-to-value (LTV) ratio loans.
Source: Mortgage Bankers Association
More from All American Investor
Follow All American Investor on Twitter
The four week moving average for the seasonally adjusted Market Index is down 9.3 percent.
The Refinance Index increased 5.9 percent to 2116.3 from 1998.1 the previous week and the seasonally adjusted Purchase Index increased 7.3 percent to 280.3 from 261.2 one week earlier.
The average contract interest rate for 30-year fixed-rate mortgages decreased to 5.44 percent from 5.50 percent, with points increasing to 0.99 from 0.89 (including the origination fee) for 80 percent loan-to-value (LTV) ratio loans.
Source: Mortgage Bankers Association
Subscribe to All American Investor via Email
 Bob DeMarco is a citizen journalist and twenty year Wall Street veteran. Bob has written more than 700 articles with more than 18,000 links to his work on the Internet. Content from All American Investor has been syndicated on Reuters, the Wall Street Journal, Fox News, Pluck, Blog Critics, and a growing list of newspaper websites. Bob is actively seeking syndication and writing assignments. Bob DeMarco is a citizen journalist and twenty year Wall Street veteran. Bob has written more than 700 articles with more than 18,000 links to his work on the Internet. Content from All American Investor has been syndicated on Reuters, the Wall Street Journal, Fox News, Pluck, Blog Critics, and a growing list of newspaper websites. Bob is actively seeking syndication and writing assignments. |
More from All American Investor
- Bond Vigilantes Take over in the Long End (Graph)
- Ten Year Treasury Yield in Orbit (Graph)
- Ten Year Interest Rates Rising (Chart)
- Option ARM--The Toxic Mortgage
- Systemic Risk Defined--Too Big to Fail
- Ray Dalio on the current state of affairs in the market
- Roubini Predicts U.S. Losses May Reach $3.6 Trillion
- 60 Minutes -- Cold Fusion

Follow All American Investor on Twitter
Thursday, June 18, 2009
Mortgage Market Deteriorates - Refinancing and Loan Rates
Are higher interesting rates effecting refinancing? Is the Housing Market picking up?
Refinancing
Refinancing
- The Refinance Index dropped 23.3 percent to 1998.1 from 2605.7.
- The four week moving average for the seasonally adjusted Refinance Index is down 19.6 percent.
- The refinance share of mortgage activity decreased to 54.1 percent of total applications from 59.4 percent the previous week.
- The Market Composite Index, a measure of mortgage loan application volume, was 514.4, a decrease of 15.8 percent on a seasonally adjusted basis from 611.0 one week earlier.
- The four week moving average for the seasonally adjusted Market Index is down 13.5 percent. The Purchase Index decreased 3.5 percent to 261.2 from 270.7 one week earlier.
Subscribe to All American Investor via Email
Tuesday, June 16, 2009
Mortgage Interest Rates Go Verticle (Graph)

The negative implications of the sharp rise in mortgage interest rates are to many to list. When interest rates rise house get more expensive. This is likely to slow the economic recovery in housing -- a real negative. Another likely outcome is the end of the refinancing boom.
Let's not forget, the Treasury has been in the markets buying Treasury securities and mortgage backed securities. As we have pointed out for many months, the Treasury balance sheet is exploding with no end in sight. Rates continue to rise against this background.
It should be clear that there is little or nothing that the FED and Treasury can do to stem the rise in longer dated securities.
Here is another little noticed fact that we will be writing about soon. Since June 1, the two year treasury has risen 26 basis points, while the ten year treasury has dropped 4 basis points. This means the yield curve is flattening. Go here for the Daily Treasury Yield Curve Rates.
My guess is in the next 12-18 months the market will realize that stagflation is the name of the game.
This is the worst thing that can happen to the dollar. The only thing that could stem a run on the dollar is FED tightening.
Subscribe to All American Investor via Email
| Bob DeMarco is a citizen journalist and twenty year Wall Street veteran. Bob has written more than 500 articles with more than 11,000 links to his work on the Internet. Content from All American Investor has been syndicated on Reuters, the Wall Street Journal, Fox News, Pluck, Blog Critics, and a growing list of newspaper websites. Bob is actively seeking syndication and writing assignments. |
More from All American Investor
- Bond Vigilantes Take over in the Long End (Graph)
- Ten Year Treasury Yield in Orbit (Graph)
- Ten Year Interest Rates Rising (Chart)
- Option ARM--The Toxic Mortgage
- Systemic Risk Defined--Too Big to Fail
- Ray Dalio on the current state of affairs in the market
- Roubini Predicts U.S. Losses May Reach $3.6 Trillion
- 60 Minutes -- Cold Fusion
Follow All American Investor on Twitter
Tuesday, June 09, 2009
The Housing and Credit Crisis Explained
This presentation on the Housing and Credit crisis is the best I have seen. It explains everything from soup to nuts.
Each slide contains a graph that is well explained.
They say a picture is worth a thousand words.
Once you get through this, you will understanding the current credit crisis in housing, and what to expect in the years ahead.
If you take the time to view and read this you will be fully informed.
Hit the full screen button in the upper right hand corner of the panel below.
T2 Partners Presentation on the Mortgage Crisis
More from All American Investor
Kindle: Amazon's 6" Wireless Reading Device
Follow All American Investor on Twitter
Each slide contains a graph that is well explained.
They say a picture is worth a thousand words.
Once you get through this, you will understanding the current credit crisis in housing, and what to expect in the years ahead.
If you take the time to view and read this you will be fully informed.
Hit the full screen button in the upper right hand corner of the panel below.
T2 Partners Presentation on the Mortgage Crisis
Publish at Scribd or explore others: Research Business & Economics Finance Non-fiction world culture
Subscribe to All American Investor via Email
| Bob DeMarco is a citizen journalist and twenty year Wall Street veteran. Bob has written more than 500 articles with more than 11,000 links to his work on the Internet. Content from All American Investor has been syndicated on Reuters, the Wall Street Journal, Fox News, Pluck, Blog Critics, and a growing list of newspaper websites. Bob is actively seeking syndication and writing assignments. |
More from All American Investor
- Bond Vigilantes Take over in the Long End (Graph)
- Ten Year Treasury Yield in Orbit (Graph)
- Ten Year Interest Rates Rising (Chart)
- Option ARM--The Toxic Mortgage
- Systemic Risk Defined--Too Big to Fail
- Ray Dalio on the current state of affairs in the market
- Roubini Predicts U.S. Losses May Reach $3.6 Trillion
- 60 Minutes -- Cold Fusion
Kindle: Amazon's 6" Wireless Reading Device Follow All American Investor on Twitter
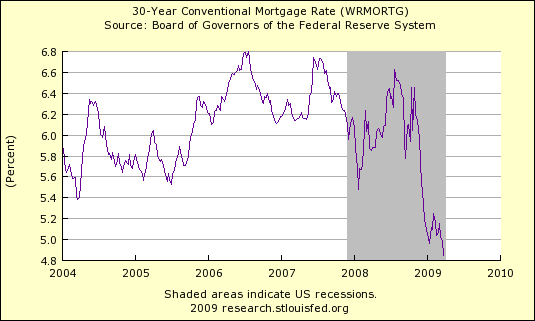
Wednesday, May 13, 2009
30 Year Conventional Mortgage Rate Ticks Up (Chart)
Slight up tick but still below 5 percent. Fed buying of mortgage backed securities and treasuries is still holding rates down.

Follow All American Investor on Twitter
Subscribe to All American Investor via Email
Follow All American Investor on Twitter
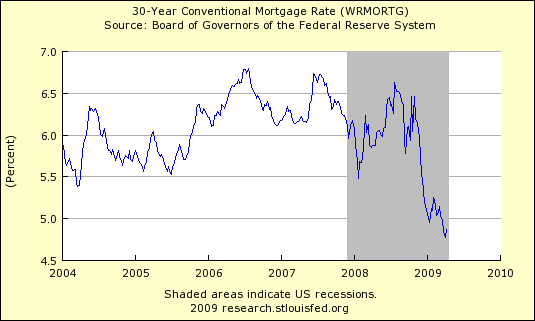
Wednesday, May 06, 2009
30 Year Conventional Mortgage Rate (Chart, 0506)

30 Year Mortgage
- Mortgage interest rate remain low and are hovering around 4.80 percent.
- Meanwhile, the ten year Treasury yield is rising and mortgages are tied to treasuries in the long run.
- Mortgage interest rates remain low as the FED continues to buy mortgage backed securities and add them to their balance sheet.
- The FED action is capping rates in the mortgage area for now.
Subscribe to All American Investor via Email
Follow All American Investor on Twitter
Saturday, April 18, 2009
30 Year Conventional Mortgage (Update, Graph)
A slight up tick in mortgage rates. Not much going on at the moment.
Average Contract Rate on Commitments for Fixed-Rate First Mortgages.
More from All American Investor
Follow All American Investor on Twitter
Average Contract Rate on Commitments for Fixed-Rate First Mortgages.
Subscribe to All American Investor via Email
| Bob DeMarco is a citizen journalist and twenty year Wall Street veteran. Bob has written more than 500 articles with more than 11,000 links to his work on the Internet. Content from All American Investor has been syndicated on Reuters, the Wall Street Journal, Fox News, Pluck, Blog Critics, and a growing list of newspaper websites. Bob is actively seeking syndication and writing assignments. |
More from All American Investor
- 30 Year Conventional Mortgage Rate (Chart)
- Top Hedge Fund Managers Make Billions in 2008
- Systemic Risk Defined--Too Big to Fail
- Ray Dalio on the current state of affairs in the market
- Roubini Predicts U.S. Losses May Reach $3.6 Trillion
- Option ARM--The Toxic Mortgage
- Warren Buffett's Annual Letter to Investors (Cliff Notes Version)
Follow All American Investor on Twitter
Thursday, April 09, 2009
30 Year Mortgage Interest Rate Chart (Update)
30 Year Conventional Mortgage Interest Rate

Current Interest Rate 4.78 Percent
Follow All American Investor on Twitter
Current Interest Rate 4.78 Percent
Subscribe to All American Investor via Email
| Bob DeMarco is a citizen journalist and twenty year Wall Street veteran. Bob has written more than 500 articles with more than 11,000 links to his work on the Internet. Content from All American Investor has been syndicated on Reuters, the Wall Street Journal, Fox News, Pluck, Blog Critics, and a growing list of newspaper websites. Bob is actively seeking syndication and writing assignments. |
Follow All American Investor on Twitter
Monday, April 06, 2009
Shhhh-----Don't Tell Anybody
The ban on foreclosure sales and evictions from houses owned by mortgage giants Fannie Mae and Freddie Mac is over. The Plan which began as a high-profile effort just before the holidays to keep people in their homes as the government tried to come up with homeowner rescue plans was announced with great fanfare.
The ban ended on March 31, but I bet most of you are hearing about it for the first time right here.
There is some good news,
The ban ended on March 31, but I bet most of you are hearing about it for the first time right here.
There is some good news,
A foreclosure sale may not occur on any Fannie Mae loan until the loan servicer verifies that the borrower is ineligible for a Home Affordable Modification and all other foreclosure prevention alternatives have been exhausted.
Brad German, a spokesman for Freddie Mac, said he was “mystified” as to how anyone could be surprised by the ban’s expiration. The idea behind it was to give the government time to create homeowner rescue plans, and that’s been done, he said. Neither agency also expects a flood of homeowners out on the street because the ban is being lifted, he added.If you would like to read a very good article on this topic go here--
“For all practical purposes, people will be in their homes for a while,” despite the ban’s expiration, German said. Fannie and Freddie will need time to approach tenants and homeowners and figure out whether they are qualified for help, he said.
Fannie, Freddie Quietly Lift Moratorium on Foreclosures
Subscribe to All American Investor via Email
| Bob DeMarco is a citizen journalist and twenty year Wall Street veteran. Bob has written more than 500 articles with more than 11,000 links to his work on the Internet. Content from All American Investor has been syndicated on Reuters, the Wall Street Journal, Fox News, Pluck, Blog Critics, and a growing list of newspaper websites. Bob is actively seeking syndication and writing assignments. |
Saturday, April 04, 2009
30 Year Conventional Mortgage Rate (Chart)
Average Contract Rate on Commitments for Fixed-Rate First Mortgages (last reading 4.85 percent).
Subscribe to All American Investor via Email
| Bob DeMarco is a citizen journalist and twenty year Wall Street veteran. Bob has written more than 500 articles with more than 11,000 links to his work on the Internet. Content from All American Investor has been syndicated on Reuters, the Wall Street Journal, Fox News, Pluck, Blog Critics, and a growing list of newspaper websites. Bob is actively seeking syndication and writing assignments. |
Follow All American Investor on Twitter
Monday, March 30, 2009
Big Boys Buying Mortgages In Reaction to Treasury Plan
Big Boy Investors like PIMCO, TCW, and Fifth Third Asset Management are buying mortgage backed securities and favoring them over treasuries.
So far the plan which is designed to lower consumer interest rates by taking supply out of the market seems to be working. A contrarian might ask? Is this front running or the makings of a trend that can be sustained over a long period of time?
Interest rate spreads are clearly narrowing across most quality preferences. The spread between the ten year Treasury and Fannie Mae’s current-coupon 30- year fixed-rate narrowed to 118 basis points last week, down from 232 basis points in November. The spread on industrial corporates narrowed from 557 basis points to 468 basis point since the announcement.
These narrowing in the interest rate spreads can also be seen as a vote of confidence for the recently announced Fed plan.
Follow All American Investor on Twitter
A March 23 Ried, Thunberg & Co. survey said fund managers overseeing $1.19 trillion cut their government securities holdings to the least this year while they increased mortgage assets.This is in reaction to the Federal Reserves March 18 plan to buy Treasuries and $750 billion of mortgage-backed securities from Fannie Mae, Freddie Mac and Ginnie Mae.
So far the plan which is designed to lower consumer interest rates by taking supply out of the market seems to be working. A contrarian might ask? Is this front running or the makings of a trend that can be sustained over a long period of time?
Interest rate spreads are clearly narrowing across most quality preferences. The spread between the ten year Treasury and Fannie Mae’s current-coupon 30- year fixed-rate narrowed to 118 basis points last week, down from 232 basis points in November. The spread on industrial corporates narrowed from 557 basis points to 468 basis point since the announcement.
These narrowing in the interest rate spreads can also be seen as a vote of confidence for the recently announced Fed plan.
Follow All American Investor on Twitter
Wednesday, March 25, 2009
You could buy this House for $165,000 in South Florida
6 Carlson Place, Palm Coast FL 32137
3 bedrooms, 2 baths, 2,178 square feet

Comes out to about $75 a square foot. Believe it or not, that might be a bit high in South Florida. On the other hand, if its your dream house that is a good price. It also has a nice pool.
I didn't look it up, but I believe homes like this one sold around $375,000 at the peak. Ouch.
Home Description:
Beautiful Carlson Park Estates. This Pool Home Sits On Two Lots Approx. 21,000Sf. On A Very Private Culdesac And Within Walking Distance To Shopping And Medical Facilities. Very Open And Spacious Living And Dining Room Combination. Tiled Kitchen And Baths, Nook And Family Room Overlooking Pool. Split Floor Plan With Vaulted Ceilings. Separate 8X10 Computer Room. This Home Is In Move-In Condition.
Source: Zillow
3 bedrooms, 2 baths, 2,178 square feet
Comes out to about $75 a square foot. Believe it or not, that might be a bit high in South Florida. On the other hand, if its your dream house that is a good price. It also has a nice pool.
I didn't look it up, but I believe homes like this one sold around $375,000 at the peak. Ouch.
Home Description:
Beautiful Carlson Park Estates. This Pool Home Sits On Two Lots Approx. 21,000Sf. On A Very Private Culdesac And Within Walking Distance To Shopping And Medical Facilities. Very Open And Spacious Living And Dining Room Combination. Tiled Kitchen And Baths, Nook And Family Room Overlooking Pool. Split Floor Plan With Vaulted Ceilings. Separate 8X10 Computer Room. This Home Is In Move-In Condition.
Source: Zillow
Subscribe to All American Investor via Email
Monday, March 23, 2009
Frontline: Ten Trillion and Counting
All of the federal government’s efforts to stem the tide in the financial meltdown that began with the subprime mortgage crisis have added hundreds of billions of dollars to our national debt. FRONTLINE reports on how this debt will constrain and challenge the new Obama administration, and on the growing chorus on both sides of the aisle that without fiscal reform, the United States government may face a debt crisis of its own which makes the current financial situation pale in comparison. Through interviews with leading experts and insiders in government finance, the film investigates the causes and potential outcomes of—and possible solutions to—America’s $10 trillion debt.
Airs on television and online starting March 24. Go here to check the schedule.
Subscribe to All American Investor via Email
Saturday, March 14, 2009
Subscribe to:
Posts (Atom)