Showing posts with label fred. Show all posts

Thursday, April 09, 2009

30 Year Mortgage Interest Rate Chart (Update)


30 Year Conventional Mortgage Interest Rate

30 Year Conventional Mortgage 409
Current Interest Rate 4.78 Percent
Subscribe to All American Investor via Email
Bob DeMarco is a citizen journalist and twenty year Wall Street veteran. Bob has written more than 500 articles with more than 11,000 links to his work on the Internet. Content from All American Investor has been syndicated on Reuters, the Wall Street Journal, Fox News, Pluck, Blog Critics, and a growing list of newspaper websites. Bob is actively seeking syndication and writing assignments.


Follow All American Investor on Twitter

Saturday, March 28, 2009

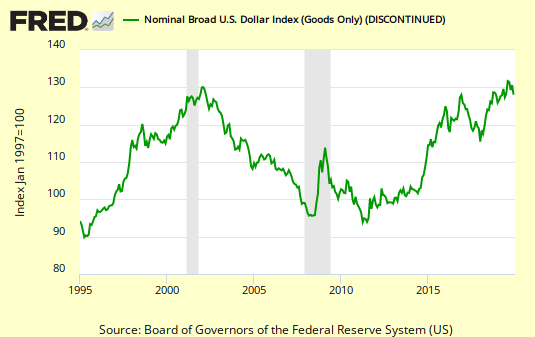
Trade Weighted Dollar Index Chart


Trade Weighted Exchange Index.

Link to the chart.

Through March 20, 2009. Current value 110.0347. Looks like a top is in. Would expect dollar to weaken making exports cheaper.

A weighted average of the foreign exchange value of the U.S. dollar against the currencies of a broad group of major U.S. trading partners.
Broad currency index includes the Euro Area, Canada, Japan, Mexico, China, United Kingdom, Taiwan, Korea, Singapore, Hong Kong, Malaysia, Brazil, Switzerland, Thailand, Philippines, Australia, Indonesia, India, Israel, Saudi Arabia, Russia, Sweden, Argentina, Venezuela, Chile and Colombia.

Follow All American Investor on Twitter
Subscribe to All American Investor via Email

Non Financial Commercial Paper Chart


Non financial Commercial Paper Chart

Link to the chart.

I am having some blog glitches and due to this problem I can only supply the link to the chart at this time.

Follow All American Investor on Twitter

Ten Year Treasury Chart, 1962 to the present


Ten Year Treasury Constant Maturity

Link to the Chart.

Friday, March 27, 2009

Vehicle Sales Plunge--Ugly Chart


Subscribe to All American Investor via Email

Saturday, March 21, 2009

Condition of Banks Continues to Deteriorate (Chart)


Condition of Banks

The Report of Condition and Income for All Insured U.S. Commercial Banks continues to deteriorate and is worrisome.

This really calls into question if the new bank bailout plan is going to work. The newest proposal is similar, if not the same, as the plan that was put into effect in September. However, if conditions continue to deteriorate it is likely that banks will need to be seized by the Federal government much like what happened during the Savings and Loan crisis.

Right now the hope remains that banks can earn their way out of the problem. This explains, in part, why the Federal Reserve is keeping interest rates artificially low and is buying Treasury securities. This strategy worked for the banks in the 1992-1993 period. It is not well known but many banks were "technically" insolvent at the time.

It appears that bank failures, a bank panic, and bank nationalizations are all still real possibilities.

We will continue to watch this situation at All American Investor.

Sidenote: Federal regulators Friday seized control of the two largest wholesale credit unions — U.S. Central Federal Credit Union and Western Corporate Federal Credit Union — which together had $57 billion in assets. This went virtually unnoticed.
Subscribe to All American Investor via Email


Bob DeMarco is a citizen journalist and twenty year Wall Street veteran. Bob has written more than 500 articles with more than 11,000 links to his work on the Internet. Content from All American Investor has been syndicated on Reuters, the Wall Street Journal, Fox News, Pluck, Blog Critics, and a growing list of newspaper websites. Bob is actively seeking syndication and writing assignments.

Follow All American Investor on Twitter

Dollar Index Turning Down (Chart and Analysis)


Dollar Index March 2009


After the Treasury announcement this week, the dollar index traded sharply lower. Along with this, oil and commodity prices moved higher as should be expected.

The market is currently in a downside range expansion. The sharp trade below the blue line (two standard deviations down from the mid point) indicates that the market is oversold and due for a correction or consolidation on a short term basis. If the dollar index fails to regain the 84.00 level and hold, it would be a major negative. The trend is turning down.

The longer term chart of the Dollar Index indicates a major double top with an extended right top that found no new buyers. This is potentially extremely negative. We will put that chart up tomorrow with some analysis.
Subscribe to All American Investor via Email

Dollar versus Euro Exchange Rate (Chart)


The chart has an interesting long term double bottom. The chart is evidencing a fear of inflation in the U. S. Along with the Chart on Money Supply, M2, these series should be watched closely.
Subscribe to All American Investor via Email

Money Supply continues to Soar (Chart)


Money Suppy320

M2, Money Stock continues to soar and accelerate. Chart current through March 20.
Subscribe to All American Investor via Email

Tuesday, March 17, 2009

The Real Picture on Housing Starts--Chart


They say a picture is worth a thousand words. You can decide for yourself.

HOUSING STARTS
Privately-owned housing starts in February were at a seasonally adjusted annual rate of 583,000. This is 22.2 percent (±13.8%) above the revised January estimate of 477,000, but is 47.3 percent (±5.3%) below the revised February 2008 rate of 1,107,000.

Single-family housing starts in February were at a rate of 357,000; this is 1.1 percent (±11.0%)* above the January figure of 353,000.

The February rate for units in buildings with five units or more was 212,000.
Housing Starts Feb 2009

Source: ST. Louis Federal Reserve, Census Bureau
Subscribe to All American Investor via Email


Are the Housing Start Numbers Really a Surprise?


On the business channels, like CNBC, they are really talking up the surprise in the housing starts number. Are they really a surprise?

I wrote previously about how 80 percent of the housing crisis is contained in 35 counties. That is, 35 counties throughout the entire country. Much of the crisis is contained in a small number of geographic areas. Although, the unemployment situation is certainly becoming a factor nationally in he housing statistics. This would be especially true if you live in an area hit by major layoff.

The numbers reported today if looked at in the proper context are pitiful. The seasonally adjusted annual rate of 583,000 units is nothing to write home to "mama" about. This compares to the February 2008 rate of 1,107,000. Down 47 percent.

The more important building permits number rose 3 percent, to a seasonally adjusted annual rate of 547,000. This number does not indicate a surge in the housing market.

Subscribe to All American Investor via Email

Housing Starts Post Surprise Rebound, Up 22%

The number of new housing projects that builders broke ground on in February rose sharply, defying economists' forecasts for yet another drop in activity.

The Commerce Department reported Tuesday that construction of new homes and apartments jumped 22.2 percent from January to a seasonally adjusted annual rate of 583,000 units. Economists were expecting construction to drop to a pace of around 450,000 units.

February's pickup was led by a big increase in apartment construction.

By region, all parts of the country reported an increase in overall housing construction, except for the West, which led the housing boom and has been hard hit by the bust.

Overall housing construction activity fell to a pace of 477,000 units in January, according to revised figures. That was a little higher than first reported but still marked a record low.

Applications for building permits, considered a reliable sign of future activity, also rose in February by 3 percent to an annual rate of 547,000. Economists were expecting permits to fall to a pace of 500,000 units.

Even with February's rare burst of activity, housing construction is down a whopping 47.3 percent from a year ago.

The collapse of the once high-flying housing market has been devastating to the United States' economic health.

Its spreading fallout has contributed to big pullbacks by consumers and businesses alike, plunging the economy into a recession now in its second year.

The Obama administration has announced a $75 billion program to stem skyrocketing home foreclosures, which have dumped even more properties on an already crippled market.

More than 2 million American homeowners faced foreclosure proceedings last year, and that number could soar as high as 10 million in the coming years depending on the severity of the recession, according to a report last month by Credit Suisse.

Home mortgages are harder to come by because of the credit crisis and unemployment is at a quarter-century peak of 8.1 percent, factors that will make it difficult for the depressed housing market to snap back to full health.

Builders aren't optimistic that will happen any time soon.

The National Association of Home Builders' housing market index was flat in March at a reading of nine. That was one point above the all-time low reached in January. Readings lower than 50 indicate negative sentiment about the market. The index has been below 10 since November, reflecting the toughest market conditions in a generation.

Tighter lending standards for home mortgages, rising defaults and fear about the housing market's future have sidelined buyers, an absence felt acutely by homebuilders such as D.R. Horton , Pulte Homes and Centex .
Copyright 2009 Reuters. Click for restrictions.

URL: http://www.cnbc.com/id/29734541/

Bob DeMarco is a citizen journalist and twenty year Wall Street veteran. Bob has written more than 500 articles with more than 11,000 links to his work on the Internet. Content from All American Investor has been syndicated on Reuters, the Wall Street Journal, Fox News, Pluck, Blog Critics, and a growing list of newspaper websites. Bob is actively seeking syndication and writing assignments.

Follow All American Investor on Twitter
More from All American Investor