Showing posts with label federal reserve. Show all posts

Wednesday, August 29, 2012

Bill Gross on Bernanke


The Federal Reserve has done a "masterful" job of keeping global markets relatively quiet, which for investors means stocks and bonds are unlikely to change much in the coming months, Bill Gross, Pimco’s co-chief investment officer, told CNBC Wednesday.

“What the Fed (learn more) has done, rather masterfully, in terms of asset markets, is to suppress volatility".

Thursday, January 12, 2012

Morning Journal, A lesson on private equity investment


Economics
This Week’s Data


The Fed released its most recent Beige Book. The tone of this latest report was noticeably more upbeat than its recent additions with positive narratives on the consumer, autos and manufacturing. Housing, it notes, is still sluggish; but inflationary pressures remain under control.

Weekly jobless claims rose 27,000 versus expectations of an increase of 3,000.
http://www.calculatedriskblog.com/2012/01/weekly-initial-unemployment-claims_12.html

December retail sales advanced 0.1% versus estimates of up 0.2%; ex autos, sales fell 0.2% versus forecasts of up 0.2%.


Tuesday, December 06, 2011

Bernanke Letter to Congress, There Was No 'Secret' Bank Bailout


There Was No 'Secret' Bank Bailout, And It Was Only $1.5 Trillion

All American Investor


Saturday, October 15, 2011

Net Free or Borrowed Reserves of Depository Institutions (Graph, 1015)


H.3 Aggregate Reserves of Depository Institutions and the Monetary Base

All American Investor

Sunday, September 04, 2011

M2 Money Stock (Chart 9-2)


M2 includes a broader set of financial assets held principally by households.

M2 consists of M1 plus: (1) savings deposits (which include money market deposit accounts, or MMDAs); (2) small-denomination time deposits (time deposits in amounts of less than $100,000); and (3) balances in retail money market mutual funds (MMMFs).

Seasonally adjusted M2 is computed by summing savings deposits, small-denomination time deposits, and retail MMMFs, each seasonally adjusted separately, and adding this result to seasonally adjusted M1.

All American Investor

Sunday, August 21, 2011

M2 Money Supply (Chart, 8-19)


M2 includes a broader set of financial assets held principally by households. M2 consists of M1 plus: (1) savings deposits (which include money market deposit accounts, or MMDAs); (2) small-denomination time deposits (time deposits in amounts of less than $100,000); and (3) balances in retail money market mutual funds (MMMFs).

By Bob DeMarco
All American Investor

Seasonally adjusted M2 is computed by summing savings deposits, small-denomination time deposits, and retail MMMFs, each seasonally adjusted separately, and adding this result to seasonally adjusted M1.

Friday, August 27, 2010

30 Year Bond Tumbles on Bernanke Comment (Chart)


By Bob DeMarco
All American Investor

The 30 Year Bond tumbled 3 points on disappointing comments by Federal Reserve Chairman Ben Bernanke.

It appears that no new bond buying by the U.S. central bank is imminent and this triggering the biggest sell-off in three months.

Saturday, May 29, 2010

St. Louis Source Base (Chart)


Sum of currency in circulation, reserve balances with Federal Reserve Banks, and service-related adjustments to compensate for float. Calculated by the Federal Reserve Bank of St. Louis.

Friday, July 17, 2009

Reserve Bank Credit (Graph)


Subscribe to All American Investor via Email
The FED is allowing securities to roll off the books. If this trend continues it won't be long before you start to see rates in the short end move up.

The massive anti-depression ease is coming to an end. I doubt that this will happen fast, but it looks like the easy money for the banks could be nearing an end.
Reserve Bank credit is the sum of securities held outright, repurchase agreements, term auction credit, other loans, net portfolio holdings of Commercial Paper Funding Facility LLC, net portfolio holdings of LLCs funded through the Money Market Investor Funding Facility, net portfolio holdings of Maiden Lane LLC, net portfolio holdings of Maiden Lane II LLC, net portfolio holdings of Maiden Lane III LLC, float, central bank liquidity swaps, and other Federal Reserve assets.
Bob DeMarco is a citizen journalist and twenty year Wall Street veteran. Bob has written more than 700 articles with more than 18,000 links to his work on the Internet. Content from All American Investor has been syndicated on Reuters, the Wall Street Journal, Fox News, Pluck, Blog Critics, and a growing list of newspaper websites. Bob is actively seeking syndication and writing assignments.


Kindle: Amazon's 6" Wireless Reading Device

Saturday, June 13, 2009

Money Supply Steady Climb Continues (M2, Graph)


Sooner or later the FEDs resolve on keeping inflation low is going to be tested. If the market place senses that the FED has lost its resolve as "inflation cops" interest rates are likely to soar.

M2 includes a broader set of financial assets held principally by households. M2 consists of M1 plus: (1) savings deposits (which include money market deposit accounts, or MMDAs); (2) small-denomination time deposits (time deposits in amounts of less than $100,000); and (3) balances in retail money market mutual funds (MMMFs). Seasonally adjusted M2 is computed by summing savings deposits, small-denomination time deposits, and retail MMMFs, each seasonally adjusted separately, and adding this result to seasonally adjusted M1.
Subscribe to All American Investor via Email

Bob DeMarco is a citizen journalist and twenty year Wall Street veteran. Bob has written more than 500 articles with more than 11,000 links to his work on the Internet. Content from All American Investor has been syndicated on Reuters, the Wall Street Journal, Fox News, Pluck, Blog Critics, and a growing list of newspaper websites. Bob is actively seeking syndication and writing assignments.


More from All American Investor

Kindle: Amazon's 6" Wireless Reading Device


Follow All American Investor on Twitter

FED Net Free or Borrowed Reserves Soaring (Graph)


Excess reserves minus discount window borrowings plus secondary borrowings.
Subscribe to All American Investor via Email

Bob DeMarco is a citizen journalist and twenty year Wall Street veteran. Bob has written more than 500 articles with more than 11,000 links to his work on the Internet. Content from All American Investor has been syndicated on Reuters, the Wall Street Journal, Fox News, Pluck, Blog Critics, and a growing list of newspaper websites. Bob is actively seeking syndication and writing assignments.


Kindle: Amazon's 6" Wireless Reading Device

Tuesday, May 12, 2009

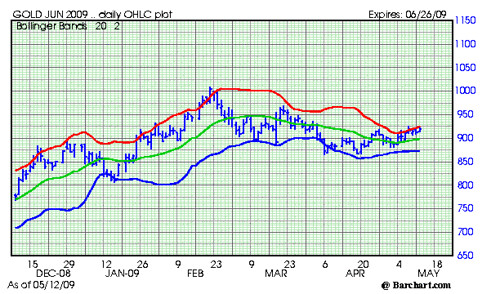
Is Gold Ready to Glitter? (Outlook, Chart)


June Gold, Bar, Chart


Gold has a tendency to be seasonally week from March through August. As a result, it is always risky to speculate in gold during this time frame.

In April, we wrote that gold was likely to test the 865 - 875 area. This happened, the market held, and made a very nice double bottom. This is now an area of major support.

Right now gold is running into resistance in the 827 area.

Any close over 827.50 would indicate that gold is ready to move higher.
Subscribe to All American Investor via Email
The market place is now starting to focus on the potential inflationary impact of the policies being carried out by the Federal Reserve and Treasury. The money supply, Fed balance sheet, and reserve balances are all soaring. The Treasury is buying mortgage backed securities and treasuries in an attempt to keep interest rates artificially low.

This is a big positive for gold. The marketplace is beginning to sense that a major increase in inflation is on the horizon. Gold is likely to discount this phenomena well in advance.

Gold, like all commodities, goes up when demand increases and supplies get tight. Both are happening right now.

What to watch:
  • Purchases of gold by the SPDR Gold Shares -- GLD. The ETF is now the sixth largest holder of gold in the world. When demand for the shares increase their purchases of physical gold increase.
  • Demand out of China. This includes buys by the Central Bank and demand for jewelry. Sooner or later demand from China is going to be explosive. While it is not well known, during the last big bull market in gold, much of the upside was fueled by purchases out of Hong Kong.
  • Any close over 827.50 basis June Gold.

Background:
  • Gold has a tendency to be weak on a seasonal basis at this time of year. This pattern usually persists until summer.
  • Industrial and jewelry demand for gold has been slow due to the weakness in the global economy.
  • The market experienced some jitters on a rumor of IMF gold sales. This is not happening.
  • The market also sold off on news out of India that demand for gold was dropping.
  • Seasonal demand patterns in gold are sometimes offset by investor demand for physical gold and ETFs.
  • Central banks continue to be large net sellers of Gold. Central banks have been net sellers of gold sales since 1999. Obviously, investor demand has been offsetting these large sales.

Here is some history on gold since 1980.
  • Gold rallied from $135 an ounce in 1978 to $860 an ounce in 1980.
  • The late 70s-80s gold rush was caused by consumer fears about inflation. The monthly CPI reading reached 1.5 percent in 1980. Gold peaked along with the inflation rate.
  • From 1980 until late 1999 gold prices trended down.
  • Gold bottomed near $250 an ounce in 1999.
  • When gold was making its lows in 1999, most of the major Central Banks around the world announced they intended to sell-off a large fraction of their gold reserves (400 tonnes a year, 2000 tonnes total).
  • Central banks are still selling their gold reserves in 2009 (500 tonnes a year, 2500 tonnes total).
  • Central banks continue to sell gold and the price continues to rise.
  • Since the late 1980s the purchases of gold by institutional investors has been rising. This trend continues and seems to be picking up momentum.
  • Demand for gold rose sharply in the fourth quarter of 2008, up 27 percent to $26.7 billion (year over year, Q4-2007 versus Q4- 2008).


    Bob DeMarco is a citizen journalist and twenty year Wall Street veteran. Bob has written more than 500 articles with more than 11,000 links to his work on the Internet. Content from All American Investor has been syndicated on Reuters, the Wall Street Journal, Fox News, Pluck, Blog Critics, and a growing list of newspaper websites. Bob is actively seeking syndication and writing assignments.


    Follow All American Investor on Twitter

Monday, April 27, 2009

Interest Rates at minus 5 Percent? (Charts)


There is an interesting article on the Financial Times pages that alludes to an internal FED analysis that the optimum interest rate right now would be -5%.
The ideal interest rate for the US economy in current conditions would be minus 5 per cent, according to internal analysis prepared for the Federal Reserve’s last policy meeting.

The analysis was based on a so-called Taylor-rule approach that estimates an appropriate interest rate based on unemployment and inflation.
Later in the article there is a short discussion of the FEDs massive expansion of bank reserves that is designed to keep rates near zero (see Reserve Bank Credit Soaring Again (Graph))

The FED has once again started buying Treasuries to keep rates down. Is it working? Just this weekend I published two charts that showed that ten year government and thirty year government bond interest rates are creeping up. See: 10 Year Treasury Closes above 3 Percent (Graph) and 30 Year Goverment Bond Signaling Problems Ahead (Chart).

All of this is worrisome and it should have holders of stocks paying attention.

Fed study puts ideal US interest rate at -5%
Subscribe to All American Investor via Email

Bob DeMarco is a citizen journalist and twenty year Wall Street veteran. Bob has written more than 500 articles with more than 11,000 links to his work on the Internet. Content from All American Investor has been syndicated on Reuters, the Wall Street Journal, Fox News, Pluck, Blog Critics, and a growing list of newspaper websites. Bob is actively seeking syndication and writing assignments.


More from All American Investor


Follow All American Investor on Twitter

Saturday, April 25, 2009

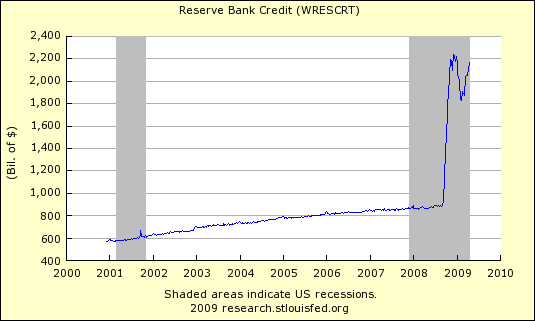
Reserve Bank Credit Soaring Again (Graph)


Reserve Bank Credit, Factors Affecting Reserve Balances

The Federal Reserve is starting to expand their balance sheet again. Week over Week.
  • The biggest increase this week is in the purchase of Mortgage Backed Securities (MBS) -- up $75 Billion. 
  • An additional $18 Billion increase in Maiden Lane LLC (Bear Stearns bailout).
  • An additional $ 34 Billion increase in Maiden Lane II LLC and Maiden Lane III LLC (AIG bailout).
  • U.S. Treasury securities held outright rose $94 Billion, and $405 Billion versus a year ago.
  • Reserve Bank Credit rose $70 Billion week, and $1.3 Trillion versus a year ago.
  • Reserve Bank Credit now stands at $2.169 Trillion and is once again approaching the peak of $2.31 Trillion (December, 2008).

Reserve Bank Credit 424

Notes: H.4.1 Reserve Bank credit is the sum of securities held outright, repurchase agreements, term auction credit, other loans, net portfolio holdings of Commercial Paper Funding Facility LLC, net portfolio holdings of LLCs funded through the Money Market Investor Funding Facility, net portfolio holdings of Maiden Lane LLC, net portfolio holdings of Maiden Lane II LLC, net portfolio holdings of Maiden Lane III LLC, float, central bank liquidity swaps, and other Federal Reserve assets
Subscribe to All American Investor via Email
Bob DeMarco is a citizen journalist and twenty year Wall Street veteran. Bob has written more than 500 articles with more than 11,000 links to his work on the Internet. Content from All American Investor has been syndicated on Reuters, the Wall Street Journal, Fox News, Pluck, Blog Critics, and a growing list of newspaper websites. Bob is actively seeking syndication and writing assignments.


Follow All American Investor on Twitter

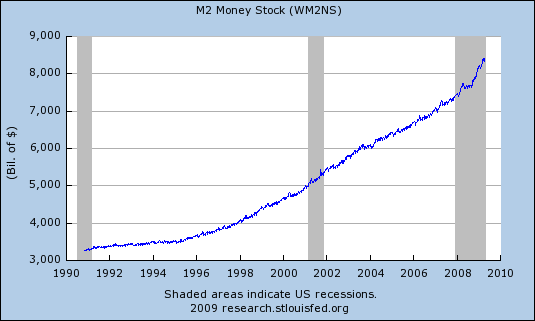
M2 Money Stock (Updated Graph)


M2 Money Stock

M2 rose to a new all time high $8,418.5 billion.

Meanwhile, the ten year Treasury moved up to close over 3 percent at 3.03. All interest rates across the curve rose.

M2 Chart 425

Note: H.6 Money Stock Measures, M2 includes a broader set of financial assets held principally by households. M2 consists of M1 plus: (1) savings deposits (which include money market deposit accounts, or MMDAs); (2) small-denomination time deposits (time deposits in amounts of less than $100,000); and (3) balances in retail money market mutual funds (MMMFs).

Subscribe to All American Investor via Email

Bob DeMarco is a citizen journalist and twenty year Wall Street veteran. Bob has written more than 500 articles with more than 11,000 links to his work on the Internet. Content from All American Investor has been syndicated on Reuters, the Wall Street Journal, Fox News, Pluck, Blog Critics, and a growing list of newspaper websites. Bob is actively seeking syndication and writing assignments.


More from All American Investor


Follow All American Investor on Twitter

Friday, April 24, 2009

Bear Bailout Cost Fed $3 Billion, So Far


The U.S. Federal Reserve report showed a $3 billion loss on the books from its deal to rescue investment bank Bear Stearns.

The number of greater concern is The Fed's combined assets of $2.25 Trillion as of Dec. 31. This number compares with $1.3 Trillion a year earlier.

The Fed balance sheet is inflationary and anyone who believe otherwise has their head in the sand.

We continue to watch the yield on the Ten Year and Thirty Year Treasury closely. We will be looking at the yield curve and its implications tomorrow.

Fed data shows big losses on Bear Stearns deal
Subscribe to All American Investor via Email


Bob DeMarco is a citizen journalist and twenty year Wall Street veteran. Bob has written more than 500 articles with more than 11,000 links to his work on the Internet. Content from All American Investor has been syndicated on Reuters, the Wall Street Journal, Fox News, Pluck, Blog Critics, and a growing list of newspaper websites. Bob is actively seeking syndication and writing assignments.


More from All American Investor


Follow All American Investor on Twitter

Wednesday, April 15, 2009

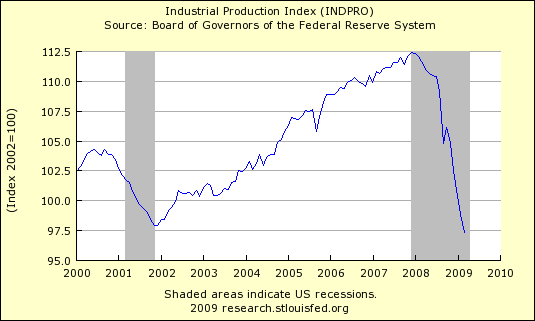
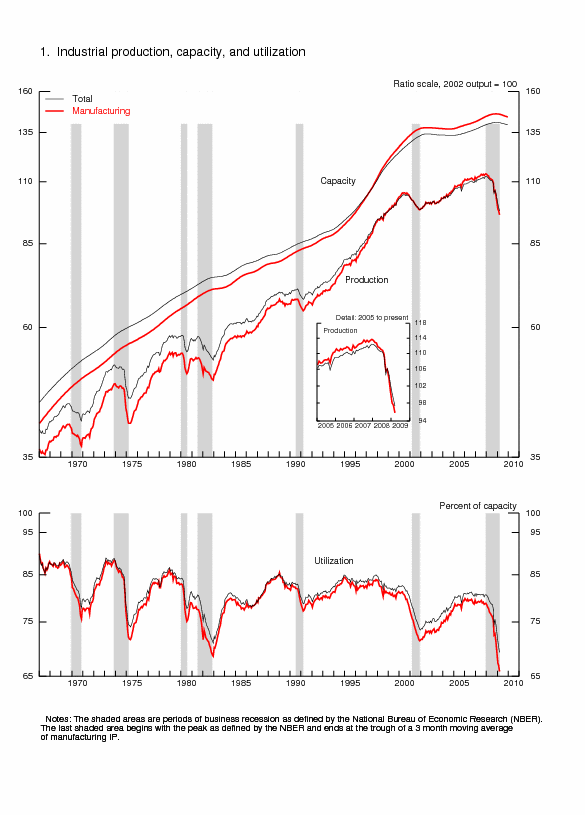
Industrial Production--A Picture Worth a Thousand Words


Industrial Production 415 all 415
Subscribe to All American Investor via Email


Bob DeMarco is a citizen journalist and twenty year Wall Street veteran. Bob has written more than 500 articles with more than 11,000 links to his work on the Internet. Content from All American Investor has been syndicated on Reuters, the Wall Street Journal, Fox News, Pluck, Blog Critics, and a growing list of newspaper websites. Bob is actively seeking syndication and writing assignments.


Kindle 2: Amazon's New Wireless Reading Device (Latest Generation)


Industrial Production Drops at Annualized 20 Percent (includes Chart)


Industrial production fell 1.5 percent in March after a similar decrease in February. For the first quarter as a whole, output dropped at an annual rate of 20.0 percent, the largest quarterly decrease of the current contraction. At 97.4 percent of its 2002 average, output in March fell to its lowest level since December 1998 and was nearly 13 percent below its year-earlier level. Production in manufacturing moved down 1.7 percent in March and has registered five consecutive quarterly decreases. Broad-based declines in production continued; one exception was the output of motor vehicles and parts, which advanced slightly in March but remained well below its year-earlier level. Outside of manufacturing, the output of mines fell 3.2 percent in March, as oil and gas well drilling continued to drop. After a relatively mild February, a return to more seasonal temperatures pushed up the output of utilities. The capacity utilization rate for total industry fell further to 69.3 percent, a historical low for this series, which begins in 1967.

Industrial Production 415
Source: Federal Reserve
Subscribe to All American Investor via Email


Kindle 2: Amazon's New Wireless Reading Device (Latest Generation)


Follow All American Investor on Twitter

Monday, April 06, 2009

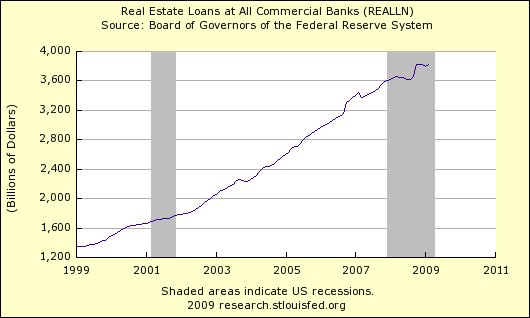
Real Estate Loans at Commercial Banks (Graph)


Still going.

Reall Estate Loans 406

For further information, please refer to the Board of Governors of the Federal Reserve System's H.8 release.Data current through Feb 1, 2009.

Bob DeMarco is a citizen journalist and twenty year Wall Street veteran. Bob has written more than 500 articles with more than 11,000 links to his work on the Internet. Content from All American Investor has been syndicated on Reuters, the Wall Street Journal, Fox News, Pluck, Blog Critics, and a growing list of newspaper websites. Bob is actively seeking syndication and writing assignments.


Follow All American Investor on Twitter

Ben Bernanke's Big Inflation Gamble


It should be clear by now that deflation has everyone, world wide, scared to death. You can look at the charts on this site that show the massive increase in money supply, the Federal Reserve Balance sheet, and just about everything government.

I am old enough to remember the monster inflation of the late 70s and early 80s. Younger people might find it hard to believe that short term interest rates rose above 20 percent, and a the 30 year Treasury yielded more than 15 percent. 

Imagine being able to buy a million dollars worth of treasuries for less than $15,000. You could have bought a zero coupon treasury for that low price and had your million in the bank. 
Now Bernanke, the soft-spoken but authoritative academic, has redefined the Federal Reserve on the fly and exercised powers that Greenspan never dared touch. Bernanke's strategy is risky, and only time will determine whether he is being brave in averting a larger crisis, or reckless in unleashing inflation that could increase quickly and uncontrollably. Today, Bernanke's gamble looks like the worst possible alternative, apart from all the others.
Simon Johnson and James Kwak are very smart guys. They are excellent at explaining the current economic scenario and putting it into perspective. I suggest you take a good look at their current article.

The Radicalization of Ben Bernanke

Tagline--He is throwing trillions of dollars at the financial crisis. What happens if his gambles don't pay off?
Subscribe to All American Investor via Email

Bob DeMarco is a citizen journalist and twenty year Wall Street veteran. Bob has written more than 500 articles with more than 11,000 links to his work on the Internet. Content from All American Investor has been syndicated on Reuters, the Wall Street Journal, Fox News, Pluck, Blog Critics, and a growing list of newspaper websites. Bob is actively seeking syndication and writing assignments.


Follow All American Investor on Twitter

More from All American Investor