Showing posts with label gld. Show all posts

Monday, July 16, 2012

The Morning Call-Monday Morning Chartology 7/16/12


The Market

Technical

Monday Morning Chartology


On Friday, the S&P rebounded back above its 50 day moving average and the uptrend off the June lows---negating the breaks of these support levels. Notice that it is in a narrowing pennant formation, the upper boundary of which is the downtrend off the April high and the lower boundary of which is the uptrend off the June low. The technical axiom is that whichever of these boundaries are ultimately broken defines future Market direction, that is, if the S&P breaks above the downtrend off the April high, the trend will be to the upside.


The GLD chart doesn’t inspire a lot of confidence, with an extended series of lower highs. Nonetheless, it has held the lower boundary of its intermediate term trading range; and until that breaks, our Portfolios will continue to hold their positions.


The VIX (16.7) remains above the lower boundary of its intermediate term trading range (15.4). The head and shoulders formation continues to develop and if the VIX breaks below that level, the trend will be re-set to down and that will be a positive for stocks.


Fundamental

Does QE really work (medium):
http://www.zerohedge.com/news/does-qe-really-work-evidence-date

ECB alters its stance on bank senior debt impairment (medium):
http://www.zerohedge.com/news/shocking-development-ecb-demands-impairment-senior-spanish-bondholders-eurocrats-resist


Economics

This Week’s Data


June retail sales came in down 0.5% versus expectations of up 0.2%; ex auto, sales were down 0.2% versus estimates of up 0.1%.

The July New York Fed manufacturing survey was reported at 7.39 versus forecasts of 5.0


Politics

Domestic


Obama on success (short): Read it and weep
http://www.zerohedge.com/news/president-obama-if-youve-got-business-you-didnt-build-someboy-else-made-happen

More shenanigans from the political class (short):
http://dailycaller.com/2012/07/13/will-obama-get-away-with-it/

An ode to Ken Salazar (medium):
http://michellemalkin.com/2012/07/13/obamas-interior-department-still-going-rogue/


Steve Cook received his education in investments from Harvard, where he earned an MBA, New York University, where he did post graduate work in economics and financial analysis and the CFA Institute, where he earned the Chartered Financial Analysts designation in 1973. His 40 years of investment experience includes institutional portfolio management at Scudder, Stevens and Clark and Bear Stearns. Steve's goal at Strategic Stock Investments is to help other investors build wealth and benefit from the investing lessons he learned the hard way.

Wednesday, July 11, 2012

The Morning Call-Our financial system is still at risk


The Market

Technical


The indices (DJIA 12653, S&P 1341) were off again yesterday, though they remain within their (1) short term trading ranges [12022-13302, 1266-1422] and (2) intermediate term uptrends [11949-16949, 1256-1836]. Within the short term trading ranges, additional support exists at 12344, 1292 and resistance at 12903, 1384. Both of the Averages closed very near their 50 day moving average; a move below this support would suggest additional downside.

Volume rose; but breadth was weak. The VIX traded up, finishing above the lower boundary of its intermediate term trading range. Importantly, it did nothing to negate the developing the head and shoulders pattern.
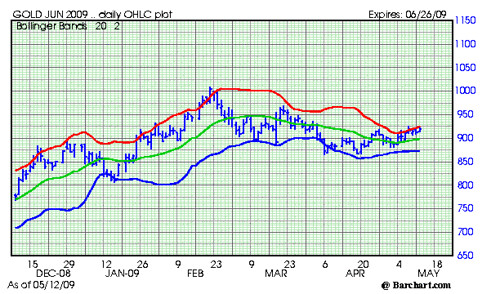
http://www.zerohedge.com/news/bearish-enough-buy-real-fear-index-says-not-so-fast

GLD (152.2) was down but closed above the lower boundary (148.2) of its intermediate term trading range.
http://www.zerohedge.com/news/china-imports-more-gold-hong-kong-five-months-all-uk-combined-gold-holdings

And:
http://www.zerohedge.com/news/guest-post-propping-gold-price

Bottom line: the weak current short term trading is bringing stocks closer to a buying range which I am presently defining as S&P 1250-1300. Until stocks reach that level, our Portfolios are doing nothing. If GLD challenges the 148.2 level, our Portfolios will Buy additional shares if that challenge is unsuccessful but reduce their positions if successful.

Is the summer rally fizzling (short):
http://blog.stocktradersalmanac.com/post/DJIA-Summer-Rally-Fizzles-Will-Earnings-be-the-Last-Shoe

Fundamental

Headlines


The economic news yesterday was a bit disappointing:

(1) weekly retail sales were positive while the small business sentiment survey was quite negative. Internationally, China trade numbers were a disappointment. This latter factor garnered the most investor attention and set a negative tone to early trading.

Is China headed for deflation? (medium):
http://blogs.telegraph.co.uk/finance/ambroseevans-pritchard/100018475/china-heads-for-a-deflationary-shock/

(2) later in the day, poor guidance from Cummins Inc [on our Buy List] deepened the gloom on the Street [even though the company raised its dividend 25%] as the stocks of companies in its space suffered some severe whackage.

Five charts on second quarter earnings (medium):
http://www.zerohedge.com/news/four-ominous-charts-q2-earnings

(3) not helping, the CFTC sued PFG [MF Global, part deux]---reminding us again of the dangers embedded in our financial system.
http://www.zerohedge.com/news/cftc-finally-gets-memo-regulator-sues-pfg-says-firm-has-200-million-customer-fund-shortfall

Under the category of ‘do the regulators have a clue’:
http://www.zerohedge.com/news/inept-cftc-get-away-driver-pfg

And (medium):
http://www.zerohedge.com/news/pfgs-chairman-was-forging-bank-documents-years-even-cftc-gave-all-clear

Under the category of ‘if Jamie Dimon doesn’t know’:
http://www.zerohedge.com/news/jpmorgan-clawback-bonuses-will-announce-cio-loss-just-over-5-billion

(4) finally, in an interview on Bloomberg, the founder of the ECRI index re-iterated his recession call.
http://www.zerohedge.com/news/ecris-achuthan-us-recession-already

This is a bit long, but it is an excellent counterpoint to the ECRI recession call:
http://advisorperspectives.com/dshort/guest/Dwaine-van-Vuuren-120710-Recession-is-Not-Imminent.php

Keeping the ball rolling downhill, the German high court said that in may take three months to rule on the Spanish bank bail out (medium):
http://www.zerohedge.com/news/german-constitutional-court-says-may-need-three-months-deliver-esm-verdict

Here is a rather detailed analysis of the Spanish bail out agreement. If you don’t want to read the whole thing, there is a summary (long):
http://www.zerohedge.com/news/pfgs-chairman-was-forging-bank-documents-years-even-cftc-gave-all-clear

Bottom line: all in all, none of this makes me feel warm and fuzzy about our forecast. That said, it is one day of news. The good news is that stocks are headed for undervalued territory. At the technical S&P 1250-1300 level, stocks will be 4-6% undervalued, which is a reasonable point to start committing cash.

The latest from Charles Biderman (5 minute video):
http://www.zerohedge.com/news/biderman-blasts-bernanke-put-and-questions-qe-hopers


Steve Cook received his education in investments from Harvard, where he earned an MBA, New York University, where he did post graduate work in economics and financial analysis and the CFA Institute, where he earned the Chartered Financial Analysts designation in 1973. His 40 years of investment experience includes institutional portfolio management at Scudder, Stevens and Clark and Bear Stearns. Steve's goal at Strategic Stock Investments is to help other investors build wealth and benefit from the investing lessons he learned the hard way.

Tuesday, July 10, 2012

The Morning Call-Germany throws a monkeywrench in the bailout, again


The Market

Technical


The indices (DJIA 12736, S&P 1352) were off yesterday, but remained within (1) their short term trading ranges (12022-13302, 1266-1422) and (2) their intermediate term uptrends (11935-16935, 1256-1836). Within the short term trading ranges, secondary support exists at 12344/1292 and resistance at 12903/1384. A very short term downtrend off the April 2012 high is currently at 12761/1368.

Volume was flattish; breadth improved slightly, though the flow of funds indicator has turned quite negative. The VIX rose, staying above the lower boundary of its intermediate term trading range. A head and shoulders formation continues to develop (a positive for stocks).

GLD rose fractionally, remaining above the lower boundary of its intermediate term trading range.

Monday, July 09, 2012

Monday Morning Chartology + Nothing has changed but GLD is worrisome


The Market

Technical

Monday Morning Chartology


Last week, the S&P (1) eliminated 1338 as viable resistance, (2) replaced it with 1364 (3) and sustained the strength of the very short term down trend off the April high. This leaves the short term trading range (1266-1422) in tact with intermediate support at 1292 and resistance at 1364. The intermediate term uptrend (1254-1834) remains in place.


GLD continues to trade in an ever narrowing range, albeit quite volatily and ever closer to the bottom of its intermediate term trading range. A break of 148.20 would prompt a lessening of our Portfolios’ exposure.


Not encouraging (chart):
http://www.bespokeinvest.com/thinkbig/2012/7/6/gold-cant-catch-a-break.html

The VIX has broken its short term up trend and appears to developing a pronounced head and shoulders formation---both positive for stocks.


Update on ‘the best stock market indicator ever’:
http://advisorperspectives.com/dshort/guest/John-Carlucci-Best-Indicator-Ever-Update.php

Fundamental

A quick review of last week’s economic data which was basically mixed (good factory orders, unsatisfactory jobs report) doesn’t suggest any need to alter or even question our current forecast. The turd in the punchbowl continues to be Europe; and while the eurocrats may be getting sore arms for all the self congratulatory back slapping, no amount of liquidity cures an insolvency problem.

Europe is not fixed (medium):
http://www.zerohedge.com/news/all-you-had-do-was-wait

And Spain just keeps getting worse (short):
http://www.zerohedge.com/news/spains-budget-deteriorates-so-much-it-gets-one-year-extension-eu-meet-deficit-targets


Steve Cook received his education in investments from Harvard, where he earned an MBA, New York University, where he did post graduate work in economics and financial analysis and the CFA Institute, where he earned the Chartered Financial Analysts designation in 1973. His 40 years of investment experience includes institutional portfolio management at Scudder, Stevens and Clark and Bear Stearns. Steve's goal at Strategic Stock Investments is to help other investors build wealth and benefit from the investing lessons he learned the hard way.

Monday, July 12, 2010

Steve Cook on Gold


From Steve Cook at

CJS Research


The price of gold (GLD) traded down last week, touched the lower boundary of an up trend dating from October 2008 and then bounced. It looks like it will open down modestly this morning. All our Portfolios will Add to their GLD position at the Market open. This will bring the size of this position to approximately 9% in each Portfolio.


Subscribe to All American Investor
Enter Your Email Address

Tuesday, May 12, 2009

Is Gold Ready to Glitter? (Outlook, Chart)


June Gold, Bar, Chart


Gold has a tendency to be seasonally week from March through August. As a result, it is always risky to speculate in gold during this time frame.

In April, we wrote that gold was likely to test the 865 - 875 area. This happened, the market held, and made a very nice double bottom. This is now an area of major support.

Right now gold is running into resistance in the 827 area.

Any close over 827.50 would indicate that gold is ready to move higher.
Subscribe to All American Investor via Email
The market place is now starting to focus on the potential inflationary impact of the policies being carried out by the Federal Reserve and Treasury. The money supply, Fed balance sheet, and reserve balances are all soaring. The Treasury is buying mortgage backed securities and treasuries in an attempt to keep interest rates artificially low.

This is a big positive for gold. The marketplace is beginning to sense that a major increase in inflation is on the horizon. Gold is likely to discount this phenomena well in advance.

Gold, like all commodities, goes up when demand increases and supplies get tight. Both are happening right now.

What to watch:
  • Purchases of gold by the SPDR Gold Shares -- GLD. The ETF is now the sixth largest holder of gold in the world. When demand for the shares increase their purchases of physical gold increase.
  • Demand out of China. This includes buys by the Central Bank and demand for jewelry. Sooner or later demand from China is going to be explosive. While it is not well known, during the last big bull market in gold, much of the upside was fueled by purchases out of Hong Kong.
  • Any close over 827.50 basis June Gold.

Background:
  • Gold has a tendency to be weak on a seasonal basis at this time of year. This pattern usually persists until summer.
  • Industrial and jewelry demand for gold has been slow due to the weakness in the global economy.
  • The market experienced some jitters on a rumor of IMF gold sales. This is not happening.
  • The market also sold off on news out of India that demand for gold was dropping.
  • Seasonal demand patterns in gold are sometimes offset by investor demand for physical gold and ETFs.
  • Central banks continue to be large net sellers of Gold. Central banks have been net sellers of gold sales since 1999. Obviously, investor demand has been offsetting these large sales.

Here is some history on gold since 1980.
  • Gold rallied from $135 an ounce in 1978 to $860 an ounce in 1980.
  • The late 70s-80s gold rush was caused by consumer fears about inflation. The monthly CPI reading reached 1.5 percent in 1980. Gold peaked along with the inflation rate.
  • From 1980 until late 1999 gold prices trended down.
  • Gold bottomed near $250 an ounce in 1999.
  • When gold was making its lows in 1999, most of the major Central Banks around the world announced they intended to sell-off a large fraction of their gold reserves (400 tonnes a year, 2000 tonnes total).
  • Central banks are still selling their gold reserves in 2009 (500 tonnes a year, 2500 tonnes total).
  • Central banks continue to sell gold and the price continues to rise.
  • Since the late 1980s the purchases of gold by institutional investors has been rising. This trend continues and seems to be picking up momentum.
  • Demand for gold rose sharply in the fourth quarter of 2008, up 27 percent to $26.7 billion (year over year, Q4-2007 versus Q4- 2008).


    Bob DeMarco is a citizen journalist and twenty year Wall Street veteran. Bob has written more than 500 articles with more than 11,000 links to his work on the Internet. Content from All American Investor has been syndicated on Reuters, the Wall Street Journal, Fox News, Pluck, Blog Critics, and a growing list of newspaper websites. Bob is actively seeking syndication and writing assignments.


    Follow All American Investor on Twitter

Monday, March 30, 2009

Gold Pops Twenty Bucks, What next? (Chart)


Gold Futures, Daily Chart.

Also see:

GoldCorp (GG) Twelve Times Your Money in Ten Years (Chart)


April Gold 330


Gold futures popped $20 off its lows this morning after stocks opened.

A look at the chart shows that price ranges are narrowing. Something is going to give soon.

From a seasonal demand perspective, the slowest period of demand for gold every year is from Spring into Summer (jewelry, industrial demand). Gold has a tendency to trend down during this period. If gold is going up from here it will take good investor demand for the physical. Demand could come from purchases by the gold exchange traded fund--GLD.

Gold made a monster run at the the end of 2008 into February 2009. The market has been moving sideways from the top.

The market continues to languish which is not a bad sign given the weak seasonal. This market should be watching closely as a breakout of this range is coming soon. The broader trend is still up.
Subscribe to All American Investor via Email
Follow All American Investor on Twitter