Economics
This Week’s Data
The July Dallas Fed manufacturing index came in at -13.2 versus expectations of +2.5 and June’s reading of +5.8.
June personal income was reported up 0.5% versus expectations of up 0.4%; personal spending was flat versus estimates of up 0.1%; the personal consumption expenditures index was up 0.1% in line; core PCE was up 0.2% versus forecasts of up 0.1%.
http://www.calculatedriskblog.com/2012/07/personal-income-increased-05-in-june.html
Showing posts with label china. Show all posts
Showing posts with label china. Show all posts
Tuesday, July 31, 2012


Wednesday, July 11, 2012
The Morning Call-Our financial system is still at risk
The Market
Technical
The indices (DJIA 12653, S&P 1341) were off again yesterday, though they remain within their (1) short term trading ranges [12022-13302, 1266-1422] and (2) intermediate term uptrends [11949-16949, 1256-1836]. Within the short term trading ranges, additional support exists at 12344, 1292 and resistance at 12903, 1384. Both of the Averages closed very near their 50 day moving average; a move below this support would suggest additional downside.
Volume rose; but breadth was weak. The VIX traded up, finishing above the lower boundary of its intermediate term trading range. Importantly, it did nothing to negate the developing the head and shoulders pattern.
http://www.zerohedge.com/news/bearish-enough-buy-real-fear-index-says-not-so-fast
GLD (152.2) was down but closed above the lower boundary (148.2) of its intermediate term trading range.
http://www.zerohedge.com/news/china-imports-more-gold-hong-kong-five-months-all-uk-combined-gold-holdings
And:
http://www.zerohedge.com/news/guest-post-propping-gold-price
Bottom line: the weak current short term trading is bringing stocks closer to a buying range which I am presently defining as S&P 1250-1300. Until stocks reach that level, our Portfolios are doing nothing. If GLD challenges the 148.2 level, our Portfolios will Buy additional shares if that challenge is unsuccessful but reduce their positions if successful.
Is the summer rally fizzling (short):
http://blog.stocktradersalmanac.com/post/DJIA-Summer-Rally-Fizzles-Will-Earnings-be-the-Last-Shoe
Fundamental
Headlines
The economic news yesterday was a bit disappointing:
(1) weekly retail sales were positive while the small business sentiment survey was quite negative. Internationally, China trade numbers were a disappointment. This latter factor garnered the most investor attention and set a negative tone to early trading.
Is China headed for deflation? (medium):
http://blogs.telegraph.co.uk/finance/ambroseevans-pritchard/100018475/china-heads-for-a-deflationary-shock/
(2) later in the day, poor guidance from Cummins Inc [on our Buy List] deepened the gloom on the Street [even though the company raised its dividend 25%] as the stocks of companies in its space suffered some severe whackage.
Five charts on second quarter earnings (medium):
http://www.zerohedge.com/news/four-ominous-charts-q2-earnings
(3) not helping, the CFTC sued PFG [MF Global, part deux]---reminding us again of the dangers embedded in our financial system.
http://www.zerohedge.com/news/cftc-finally-gets-memo-regulator-sues-pfg-says-firm-has-200-million-customer-fund-shortfall
Under the category of ‘do the regulators have a clue’:
http://www.zerohedge.com/news/inept-cftc-get-away-driver-pfg
And (medium):
http://www.zerohedge.com/news/pfgs-chairman-was-forging-bank-documents-years-even-cftc-gave-all-clear
Under the category of ‘if Jamie Dimon doesn’t know’:
http://www.zerohedge.com/news/jpmorgan-clawback-bonuses-will-announce-cio-loss-just-over-5-billion
(4) finally, in an interview on Bloomberg, the founder of the ECRI index re-iterated his recession call.
http://www.zerohedge.com/news/ecris-achuthan-us-recession-already
This is a bit long, but it is an excellent counterpoint to the ECRI recession call:
http://advisorperspectives.com/dshort/guest/Dwaine-van-Vuuren-120710-Recession-is-Not-Imminent.php
Keeping the ball rolling downhill, the German high court said that in may take three months to rule on the Spanish bank bail out (medium):
http://www.zerohedge.com/news/german-constitutional-court-says-may-need-three-months-deliver-esm-verdict
Here is a rather detailed analysis of the Spanish bail out agreement. If you don’t want to read the whole thing, there is a summary (long):
http://www.zerohedge.com/news/pfgs-chairman-was-forging-bank-documents-years-even-cftc-gave-all-clear
Bottom line: all in all, none of this makes me feel warm and fuzzy about our forecast. That said, it is one day of news. The good news is that stocks are headed for undervalued territory. At the technical S&P 1250-1300 level, stocks will be 4-6% undervalued, which is a reasonable point to start committing cash.
The latest from Charles Biderman (5 minute video):
http://www.zerohedge.com/news/biderman-blasts-bernanke-put-and-questions-qe-hopers
 Steve Cook received his education in investments from Harvard, where he earned an MBA, New York University, where he did post graduate work in economics and financial analysis and the CFA Institute, where he earned the Chartered Financial Analysts designation in 1973. His 40 years of investment experience includes institutional portfolio management at Scudder, Stevens and Clark and Bear Stearns. Steve's goal at Strategic Stock Investments is to help other investors build wealth and benefit from the investing lessons he learned the hard way.
Technical
The indices (DJIA 12653, S&P 1341) were off again yesterday, though they remain within their (1) short term trading ranges [12022-13302, 1266-1422] and (2) intermediate term uptrends [11949-16949, 1256-1836]. Within the short term trading ranges, additional support exists at 12344, 1292 and resistance at 12903, 1384. Both of the Averages closed very near their 50 day moving average; a move below this support would suggest additional downside.
Volume rose; but breadth was weak. The VIX traded up, finishing above the lower boundary of its intermediate term trading range. Importantly, it did nothing to negate the developing the head and shoulders pattern.
http://www.zerohedge.com/news/bearish-enough-buy-real-fear-index-says-not-so-fast
GLD (152.2) was down but closed above the lower boundary (148.2) of its intermediate term trading range.
http://www.zerohedge.com/news/china-imports-more-gold-hong-kong-five-months-all-uk-combined-gold-holdings
And:
http://www.zerohedge.com/news/guest-post-propping-gold-price
Bottom line: the weak current short term trading is bringing stocks closer to a buying range which I am presently defining as S&P 1250-1300. Until stocks reach that level, our Portfolios are doing nothing. If GLD challenges the 148.2 level, our Portfolios will Buy additional shares if that challenge is unsuccessful but reduce their positions if successful.
Is the summer rally fizzling (short):
http://blog.stocktradersalmanac.com/post/DJIA-Summer-Rally-Fizzles-Will-Earnings-be-the-Last-Shoe
Fundamental
Headlines
The economic news yesterday was a bit disappointing:
(1) weekly retail sales were positive while the small business sentiment survey was quite negative. Internationally, China trade numbers were a disappointment. This latter factor garnered the most investor attention and set a negative tone to early trading.
Is China headed for deflation? (medium):
http://blogs.telegraph.co.uk/finance/ambroseevans-pritchard/100018475/china-heads-for-a-deflationary-shock/
(2) later in the day, poor guidance from Cummins Inc [on our Buy List] deepened the gloom on the Street [even though the company raised its dividend 25%] as the stocks of companies in its space suffered some severe whackage.
Five charts on second quarter earnings (medium):
http://www.zerohedge.com/news/four-ominous-charts-q2-earnings
(3) not helping, the CFTC sued PFG [MF Global, part deux]---reminding us again of the dangers embedded in our financial system.
http://www.zerohedge.com/news/cftc-finally-gets-memo-regulator-sues-pfg-says-firm-has-200-million-customer-fund-shortfall
Under the category of ‘do the regulators have a clue’:
http://www.zerohedge.com/news/inept-cftc-get-away-driver-pfg
And (medium):
http://www.zerohedge.com/news/pfgs-chairman-was-forging-bank-documents-years-even-cftc-gave-all-clear
Under the category of ‘if Jamie Dimon doesn’t know’:
http://www.zerohedge.com/news/jpmorgan-clawback-bonuses-will-announce-cio-loss-just-over-5-billion
(4) finally, in an interview on Bloomberg, the founder of the ECRI index re-iterated his recession call.
http://www.zerohedge.com/news/ecris-achuthan-us-recession-already
This is a bit long, but it is an excellent counterpoint to the ECRI recession call:
http://advisorperspectives.com/dshort/guest/Dwaine-van-Vuuren-120710-Recession-is-Not-Imminent.php
Keeping the ball rolling downhill, the German high court said that in may take three months to rule on the Spanish bank bail out (medium):
http://www.zerohedge.com/news/german-constitutional-court-says-may-need-three-months-deliver-esm-verdict
Here is a rather detailed analysis of the Spanish bail out agreement. If you don’t want to read the whole thing, there is a summary (long):
http://www.zerohedge.com/news/pfgs-chairman-was-forging-bank-documents-years-even-cftc-gave-all-clear
Bottom line: all in all, none of this makes me feel warm and fuzzy about our forecast. That said, it is one day of news. The good news is that stocks are headed for undervalued territory. At the technical S&P 1250-1300 level, stocks will be 4-6% undervalued, which is a reasonable point to start committing cash.
The latest from Charles Biderman (5 minute video):
http://www.zerohedge.com/news/biderman-blasts-bernanke-put-and-questions-qe-hopers

Monday, March 05, 2012
Stocks and Economy News 119
China Slices 2012 Growth Target to Eight-Year Low
Chinese Premier Wen Jiabao cut his nation's 2012 growth target to an eight-year low of 7.5 percent and made boosting consumer demand the year's first priority as Beijing looks to wean the economy off its reliance on external demand and foreign capital.
He lowered the target from a longstanding annual goal of 8 percent, a move investors anticipated so that Beijing has some economic leeway to rebalance the economy and defuse price pressures in the run up to a leadership change later this year.
Read more
All American Investor
Wednesday, November 16, 2011
CNBC Million Dollar Portfolio Challenge Bonus Bucks Answers, Thursday, November 17
1. According to Darren Rovell’s calculations, how much of their own money did NBA players put on the line with their announced intention to disband their union?
ANSWER: $3.3 billion
2. According to chartist Daryl Guppy, the upside for Nymex oil over the next few weeks is capped at?
ANSWER: $110-115
3. According to CNBC.com's guest writer Shaun Rein, which luxury brand is getting too popular for its own good in China?
Answer: Louis Vuitton
ANSWER: $3.3 billion
2. According to chartist Daryl Guppy, the upside for Nymex oil over the next few weeks is capped at?
ANSWER: $110-115
3. According to CNBC.com's guest writer Shaun Rein, which luxury brand is getting too popular for its own good in China?
Answer: Louis Vuitton
Friday, October 14, 2011
@AllAmerInvest AAPL, iPhone4S, Roubini, Bonus Bucks, Shh
What's Inside The iPhone 4S?
Apple Could Sell 4 Million Phones This Weekend
http://read.bi/nluaup
Roubini: The Instability of Inequality
http://bit.ly/n82csq
All American Investor
CNBC Bonus Bucks Answers for Friday, October 14, 2011
http://bit.ly/ovdgjj
Thursday, August 26, 2010
New Gold Demand Trends, Supply, and Demand Statistics Q2 2010
By Bob DeMarco
All American Investor
Demand statistics for Q2 2010
All American Investor
Demand statistics for Q2 2010
- Total gold demand in Q2 2010 rose by 36% to 1,050 tonnes, largely reflecting strong gold investment demand compared to the second quarter of 2009. In US$ value terms, demand increased 77% to $40.4 billion.
- Investment demand was the strongest performing segment during the second quarter, posting a rise of 118% to 534.4 tonnes compared with 245.4 tonnes in Q2 2009.
Tuesday, August 10, 2010
China Real Estate The Mother of All Bubbles (Chart)
The Mother of All Bubbles
Take a gander at home prices in China. Since the 2008 financial crisis, the Chinese housing market has skyrocketed 60%. There are now 65 million vacant housing units. The question is no longer whether there is a Chinese housing bubble, but when will it pop. There is one thing that bubbles ALWAYS do. An that is POP!!!
Wednesday, August 04, 2010
China Said to Test Banks for 60% Home-Price Drop
Banks were instructed to include worst-case scenarios of prices dropping 50 percent to 60 percent in cities where they have risen excessively, the person said, declining to be identified because the regulator’s requirement hasn’t been publicly announced. Previous stress tests carried out in the past year assumed home-price declines of as much as 30 percent.
China Said to Test Banks for 60% Home-Price Drop
China Said to Test Banks for 60% Home-Price Drop
Wednesday, July 21, 2010
The United States of...China?
The United States of...China? China's great outward march of investing into the United States is turning into a mad dash. Chinese investments into the U.S. rose 360% in the first half of this year compared to last year, according to Chinese government figures released Tuesday.
|


Roubini on Gold
For the better part of 10 years running, all that glitters has, in fact, been gold. Since 2001, the precious metal has outperformed all of the core asset classes, gaining an average 15.3% per year in dollar terms since January 2001.
Thursday, June 18, 2009
Economist Samuelson Warns about China Pessimism and a Run on the Dollar
These are sobering words from renowned economist Paul Samuelson.
Some day -- maybe even soon -- China will turn pessimistic on the U.S. dollar.The threat that China and others countries might divest the dollar is starting to cause jitters in the Treasury market. If the countries Samuelson mentioned held on to their dollar assets --but cut back on their purchases of U.S. Treasuries-- interest rates higher immediately.That means lethal troubles for the future U.S. economy.
When a disorderly run against the dollar occurs, I believe a truly global financial panic is to be feared. China, Japan and Korea now hold dollars not because they think dollars will stay safe.
Why then?.....
The given in this equation is that the amounts of Treasuries coming on to the market in the years ahead is enormous.
Growing supply, and the likelihood that U. S. Treasury debt will get downgraded, means that the risk premium for owning longer dated treasuries is likely to rise and rise sharply.
Growing supply, and the likelihood that U. S. Treasury debt will get downgraded, means that the risk premium for owning longer dated treasuries is likely to rise and rise sharply.
During the early 1990s this risk premium rose to more than five percent.
Lets say we find ourselves with a three percent inflation rate in the next 12-18 months. What is the rate we could see in the ten years treasury?
8-11 percent. Inflation, inflation expectation, dollar risk, supply, plus a fair rate of interest all add to the interest rate that investors will demand in order to buy. It is not hard to envision five or more points of risk premium.
Does it make good sense in this environment to be fully invested in stocks?
My guess is that we are going to see a sharp uptick in inflation in the next 12-18 months. Given the enormous expansion in the money supply it is not hard to envision three percent inflation. Add in the necessary risk premium for owning longer dated securities, and it is not hard to envision sharply higher rates.
Right now most analysts continue to mention how inflation is not a problem. In 1980, when inflation was hitting 1.5 percent per month, analysts were forecasting higher inflation and higher interest rates in the future. Inflation peaked right then and right there.
Lets say we find ourselves with a three percent inflation rate in the next 12-18 months. What is the rate we could see in the ten years treasury?
8-11 percent. Inflation, inflation expectation, dollar risk, supply, plus a fair rate of interest all add to the interest rate that investors will demand in order to buy. It is not hard to envision five or more points of risk premium.
Does it make good sense in this environment to be fully invested in stocks?
My guess is that we are going to see a sharp uptick in inflation in the next 12-18 months. Given the enormous expansion in the money supply it is not hard to envision three percent inflation. Add in the necessary risk premium for owning longer dated securities, and it is not hard to envision sharply higher rates.
Right now most analysts continue to mention how inflation is not a problem. In 1980, when inflation was hitting 1.5 percent per month, analysts were forecasting higher inflation and higher interest rates in the future. Inflation peaked right then and right there.
Our we at the trough in inflation now?
Anybody old enough to remember when the ten year treasury yield was above 15 percent? Three month treasury bill at 14 percent?
It is time to be risk adverse. Not the time to be betting the ranch in the stock market.
To read the entire Samuelson article go here.
More from All American Investor
Follow All American Investor on Twitter
Anybody old enough to remember when the ten year treasury yield was above 15 percent? Three month treasury bill at 14 percent?
It is time to be risk adverse. Not the time to be betting the ranch in the stock market.
To read the entire Samuelson article go here.
Subscribe to All American Investor via Email
 Bob DeMarco is a citizen journalist and twenty year Wall Street veteran. Bob has written more than 700 articles with more than 18,000 links to his work on the Internet. Content from All American Investor has been syndicated on Reuters, the Wall Street Journal, Fox News, Pluck, Blog Critics, and a growing list of newspaper websites. Bob is actively seeking syndication and writing assignments. Bob DeMarco is a citizen journalist and twenty year Wall Street veteran. Bob has written more than 700 articles with more than 18,000 links to his work on the Internet. Content from All American Investor has been syndicated on Reuters, the Wall Street Journal, Fox News, Pluck, Blog Critics, and a growing list of newspaper websites. Bob is actively seeking syndication and writing assignments. |
More from All American Investor
- Bond Vigilantes Take over in the Long End (Graph)
- Ten Year Treasury Yield in Orbit (Graph)
- Ten Year Interest Rates Rising (Chart)
- Option ARM--The Toxic Mortgage
- Systemic Risk Defined--Too Big to Fail
- Ray Dalio on the current state of affairs in the market
- Roubini Predicts U.S. Losses May Reach $3.6 Trillion
- 60 Minutes -- Cold Fusion


Follow All American Investor on Twitter
Tuesday, June 02, 2009
Gold | Fourth Time Up the Charm (Chart)
Gold, Cash, Monthly, Chart
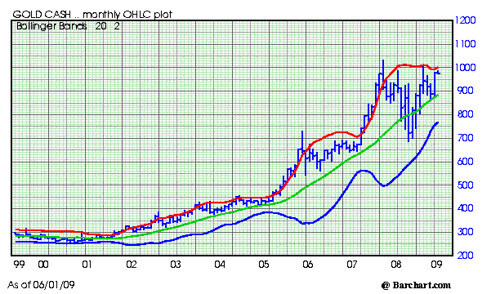
There is a saying in technical trading that the fourth time up is the charm.
As you can see by looking at the Gold Chart, this is the fourth time up.
I am a little surprised by the rise in Gold at this time of year.
A close in Gold over 1,067.50 is likely to lead to an explosive up leg in gold. I am expecting this to happen, and the rise could very well be much higher than is currently being forecast by most.
I wrote previously about how I expect the buying of Gold out of Hong Kong to be enormous once the bull leg gets underway.
There is a saying in technical trading that the fourth time up is the charm.
As you can see by looking at the Gold Chart, this is the fourth time up.
I am a little surprised by the rise in Gold at this time of year.
- The more normal seasonal pattern is for Gold to peak in February - March.
- After the seasonal peak, Gold normally trades down into the August - October period.
- The strongest trading period for Gold normally occurs from October into March.
- The seasonal pattern tells me that Gold is likely to take a rest.
- On the other hand, the market looks very strong, technically, right now.
A close in Gold over 1,067.50 is likely to lead to an explosive up leg in gold. I am expecting this to happen, and the rise could very well be much higher than is currently being forecast by most.
I wrote previously about how I expect the buying of Gold out of Hong Kong to be enormous once the bull leg gets underway.
Back in the bull market of 1978 - 1980, Gold was often up sharply at the U.S. open based on large buying out of Hong Kong. Buying power from the China mainland should be a major factor in the price of gold in the year ahead. The buying is already picking up some momentum.
My experience tells me Gold is due for another correction back toward the 925 area -- the typical seasonal pattern. On the other hand, a break above this existing top could lead to a monster rally.
Long term gold traders should be patient and let it happen. Buyers of Gold stocks should see gains like they have rarely seen in the year ahead.
More from All American Investor
Kindle: Amazon's Wireless Reading Device (Latest Generation)
My experience tells me Gold is due for another correction back toward the 925 area -- the typical seasonal pattern. On the other hand, a break above this existing top could lead to a monster rally.
Long term gold traders should be patient and let it happen. Buyers of Gold stocks should see gains like they have rarely seen in the year ahead.
Subscribe to All American Investor via Email
| Bob DeMarco is a citizen journalist and twenty year Wall Street veteran. Bob has written more than 500 articles with more than 11,000 links to his work on the Internet. Content from All American Investor has been syndicated on Reuters, the Wall Street Journal, Fox News, Pluck, Blog Critics, and a growing list of newspaper websites. Bob is actively seeking syndication and writing assignments. |
More from All American Investor
- Top Hedge Fund Managers Make Billions in 2008
- Systemic Risk Defined--Too Big to Fail
- Ray Dalio on the current state of affairs in the market
- Roubini Predicts U.S. Losses May Reach $3.6 Trillion
- Option ARM--The Toxic Mortgage
- Warren Buffett's Annual Letter to Investors (Cliff Notes Version)
Wednesday, May 20, 2009
Roubini on Gold, China, IMF Sales
Gold is a special commodity in that the fundamentals of physical supply and demand are minor influences on its price. Gold’s price is most often driven by speculative demand for a hedge against inflation or economic uncertainty. Many investors see gold as a substitute for fiat currencies. Consequently, gold prices sometimes track changes in central bank holdings of gold.Source RGE Monitor Newsletter and RGE Monitor
Gold markets largely ignored China’s surprise revelation that it had increased its gold reserves as much of this had already been priced in by speculators. Moreover, China produces its own gold. The increase in China's gold holdings is just a mere drop in the bucket of its total $1.9 trillion in foreign exchange reserves. Gold's share in China's foreign exchange reserves remains much lower than the global average and well below the U.S. share. But China's interest in gold is consistent with its taste for real assets to gradually diversify from its U.S. bond-heavy portfolio. If other central banks followed suit, gold demand could increase sharply.
IMF gold sales will likely have little impact on gold prices if it sells its gold to central banks rather than the free market. The European Central Bank Gold Agreement’s expiration in September 2009 may have more impact. The signatories are likely to renew the agreement and continue limiting central bank gold sales. Fears that monetization of rising public debts will erode currency values may spark demand for gold as an inflation hedge.

Subscribe to All American Investor via Email
| Bob DeMarco is a citizen journalist and twenty year Wall Street veteran. Bob has written more than 500 articles with more than 11,000 links to his work on the Internet. Content from All American Investor has been syndicated on Reuters, the Wall Street Journal, Fox News, Pluck, Blog Critics, and a growing list of newspaper websites. Bob is actively seeking syndication and writing assignments. |
More from All American Investor
- 30 Year Conventional Mortgage Rate (Chart)
- Top Hedge Fund Managers Make Billions in 2008
- Systemic Risk Defined--Too Big to Fail
- Ray Dalio on the current state of affairs in the market
- Roubini Predicts U.S. Losses May Reach $3.6 Trillion
- Option ARM--The Toxic Mortgage
- Warren Buffett's Annual Letter to Investors (Cliff Notes Version)
Follow All American Investor on Twitter
Friday, May 15, 2009
Roubini on the U.S. Dollar and the Chinese Yuan
The Almighty Renminbi?
More from All American Investor
Follow All American Investor on Twitter
Now, imagine a world in which China could borrow and lend internationally in its own currency. The renminbi, rather than the dollar, could eventually become a means of payment in trade and a unit of account in pricing imports and exports, as well as a store of value for wealth by international investors. Americans would pay the price. We would have to shell out more for imported goods, and interest rates on both private and public debt would rise. The higher private cost of borrowing could lead to weaker consumption and investment, and slower growth.Also see Roubini vs. Zhou on the U.S. Dollar and the Chinese Yuan
Subscribe to All American Investor via Email
| Bob DeMarco is a citizen journalist and twenty year Wall Street veteran. Bob has written more than 500 articles with more than 11,000 links to his work on the Internet. Content from All American Investor has been syndicated on Reuters, the Wall Street Journal, Fox News, Pluck, Blog Critics, and a growing list of newspaper websites. Bob is actively seeking syndication and writing assignments. |
More from All American Investor
- 30 Year Conventional Mortgage Rate (Chart)
- Top Hedge Fund Managers Make Billions in 2008
- Systemic Risk Defined--Too Big to Fail
- Ray Dalio on the current state of affairs in the market
- Roubini Predicts U.S. Losses May Reach $3.6 Trillion
- Option ARM--The Toxic Mortgage
- Warren Buffett's Annual Letter to Investors (Cliff Notes Version)
Follow All American Investor on Twitter
Tuesday, May 12, 2009
Is Gold Ready to Glitter? (Outlook, Chart)
June Gold, Bar, Chart
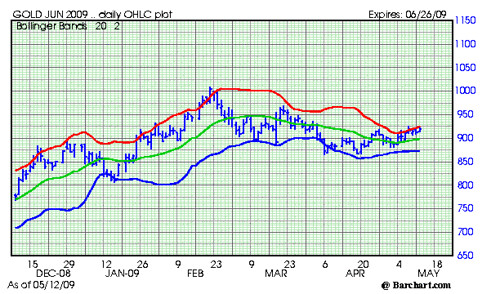
Gold has a tendency to be seasonally week from March through August. As a result, it is always risky to speculate in gold during this time frame.
In April, we wrote that gold was likely to test the 865 - 875 area. This happened, the market held, and made a very nice double bottom. This is now an area of major support.
Right now gold is running into resistance in the 827 area.
Any close over 827.50 would indicate that gold is ready to move higher.
This is a big positive for gold. The marketplace is beginning to sense that a major increase in inflation is on the horizon. Gold is likely to discount this phenomena well in advance.
Gold, like all commodities, goes up when demand increases and supplies get tight. Both are happening right now.
What to watch:
Background:
Here is some history on gold since 1980.
Gold has a tendency to be seasonally week from March through August. As a result, it is always risky to speculate in gold during this time frame.
In April, we wrote that gold was likely to test the 865 - 875 area. This happened, the market held, and made a very nice double bottom. This is now an area of major support.
Right now gold is running into resistance in the 827 area.
Any close over 827.50 would indicate that gold is ready to move higher.
Subscribe to All American Investor via EmailThe market place is now starting to focus on the potential inflationary impact of the policies being carried out by the Federal Reserve and Treasury. The money supply, Fed balance sheet, and reserve balances are all soaring. The Treasury is buying mortgage backed securities and treasuries in an attempt to keep interest rates artificially low.
This is a big positive for gold. The marketplace is beginning to sense that a major increase in inflation is on the horizon. Gold is likely to discount this phenomena well in advance.
Gold, like all commodities, goes up when demand increases and supplies get tight. Both are happening right now.
What to watch:
- Purchases of gold by the SPDR Gold Shares -- GLD. The ETF is now the sixth largest holder of gold in the world. When demand for the shares increase their purchases of physical gold increase.
- Demand out of China. This includes buys by the Central Bank and demand for jewelry. Sooner or later demand from China is going to be explosive. While it is not well known, during the last big bull market in gold, much of the upside was fueled by purchases out of Hong Kong.
- Any close over 827.50 basis June Gold.
Background:
- Gold has a tendency to be weak on a seasonal basis at this time of year. This pattern usually persists until summer.
- Industrial and jewelry demand for gold has been slow due to the weakness in the global economy.
- The market experienced some jitters on a rumor of IMF gold sales. This is not happening.
- The market also sold off on news out of India that demand for gold was dropping.
- Seasonal demand patterns in gold are sometimes offset by investor demand for physical gold and ETFs.
- Central banks continue to be large net sellers of Gold. Central banks have been net sellers of gold sales since 1999. Obviously, investor demand has been offsetting these large sales.
Here is some history on gold since 1980.
- Gold rallied from $135 an ounce in 1978 to $860 an ounce in 1980.
- The late 70s-80s gold rush was caused by consumer fears about inflation. The monthly CPI reading reached 1.5 percent in 1980. Gold peaked along with the inflation rate.
- From 1980 until late 1999 gold prices trended down.
- Gold bottomed near $250 an ounce in 1999.
- When gold was making its lows in 1999, most of the major Central Banks around the world announced they intended to sell-off a large fraction of their gold reserves (400 tonnes a year, 2000 tonnes total).
- Central banks are still selling their gold reserves in 2009 (500 tonnes a year, 2500 tonnes total).
- Central banks continue to sell gold and the price continues to rise.
- Since the late 1980s the purchases of gold by institutional investors has been rising. This trend continues and seems to be picking up momentum.
- Demand for gold rose sharply in the fourth quarter of 2008, up 27 percent to $26.7 billion (year over year, Q4-2007 versus Q4- 2008).Bob DeMarco is a citizen journalist and twenty year Wall Street veteran. Bob has written more than 500 articles with more than 11,000 links to his work on the Internet. Content from All American Investor has been syndicated on Reuters, the Wall Street Journal, Fox News, Pluck, Blog Critics, and a growing list of newspaper websites. Bob is actively seeking syndication and writing assignments.
Follow All American Investor on Twitter
Thursday, April 23, 2009
China Buying Copper (+ Chart)
China is on a buying spree in copper. China State Reserves Bureau bought up 329,000 tonnes of copper in February and 375,000 tonnes in March. This explains in part the 70% surge in copper prices since the lows were made in December.
There is saying in copper -- buy on Thanksgiving, sell on Easter. Worked pretty good this year. Although, it was a little hair raising from Thanksgiving to the December low.
China has also been a big buyer of metals like aluminum, nickel, zinc, and tin.
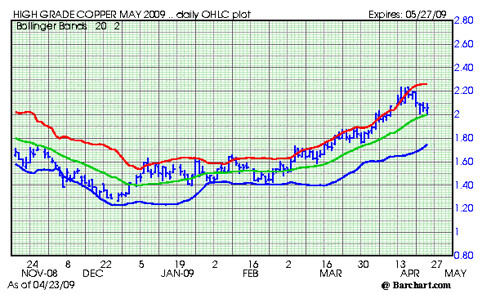
Chart Notes:
More from All American Investor
Follow All American Investor on Twitter
There is saying in copper -- buy on Thanksgiving, sell on Easter. Worked pretty good this year. Although, it was a little hair raising from Thanksgiving to the December low.
China has also been a big buyer of metals like aluminum, nickel, zinc, and tin.
Chart Notes:
- Copper was overbought at the rally highs.
- Copper traded above the red line (two standard deviations above the mean) and was due for a correction.
- The market is currently testing the green line and 2.00.
- The trend is up and the short, intermediate, and long term averages are all pointing up.
- First support is around 2.00 and major support is in a band from 1.80 to 1.90.
- Resistance is at the current highs around 2.23.
- Technicals point to higher prices.
Subscribe to All American Investor via Email
| Bob DeMarco is a citizen journalist and twenty year Wall Street veteran. Bob has written more than 500 articles with more than 11,000 links to his work on the Internet. Content from All American Investor has been syndicated on Reuters, the Wall Street Journal, Fox News, Pluck, Blog Critics, and a growing list of newspaper websites. Bob is actively seeking syndication and writing assignments. |
More from All American Investor
- 30 Year Conventional Mortgage Rate (Chart)
- Top Hedge Fund Managers Make Billions in 2008
- Systemic Risk Defined--Too Big to Fail
- Ray Dalio on the current state of affairs in the market
- Roubini Predicts U.S. Losses May Reach $3.6 Trillion
- Option ARM--The Toxic Mortgage
- Warren Buffett's Annual Letter to Investors (Cliff Notes Version)
Follow All American Investor on Twitter
Thursday, April 16, 2009
China’s Economy Grows 6.1%, Inflation next?
China’s economy grew 6.1% in the first quarter, that is the good news. The bad news? The Chinese economy grew at the slowest pace in almost a decade. We can only wish.
The important news is that China's industrial production grew 8.3% during March up from 3.8 percent in the first two months. Retail sales rose 14.7%.
The real news here is that commodity prices are going to start rising due to Chinese demand. We already showed the effect, two days ago, on Chinese demand for copper and how it is causing the price of copper to rise sharply.
I continue to encourage investors to get into stocks that will benefit from rising inflation. We will discuss more of these in the days ahead.
I have mentioned the ETF, MOO, several times on this website in the past. This is a good example of a stock that benefits from inflation. We will also be discussing Freeport McMoran (FCX), which we mentioned a few days ago.
We will be discussing good inflation stocks in the days ahead, so remember to stay tune in for those ideas.
The important news is that China's industrial production grew 8.3% during March up from 3.8 percent in the first two months. Retail sales rose 14.7%.
The real news here is that commodity prices are going to start rising due to Chinese demand. We already showed the effect, two days ago, on Chinese demand for copper and how it is causing the price of copper to rise sharply.
I continue to encourage investors to get into stocks that will benefit from rising inflation. We will discuss more of these in the days ahead.
I have mentioned the ETF, MOO, several times on this website in the past. This is a good example of a stock that benefits from inflation. We will also be discussing Freeport McMoran (FCX), which we mentioned a few days ago.
We will be discussing good inflation stocks in the days ahead, so remember to stay tune in for those ideas.
Subscribe to All American Investor via Email
Kindle 2: Amazon's New Wireless Reading Device (Latest Generation)
Follow All American Investor on Twitter
Tuesday, April 14, 2009
Copper Soaring, China Buying (Chart)
Cash Copper, Daily Price Mark
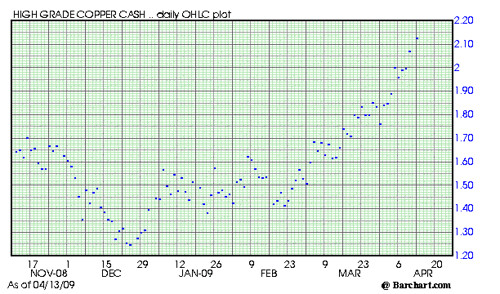
The chart contains a single price (dot) for each trading day.
Notes:
Follow All American Investor on Twitter
The chart contains a single price (dot) for each trading day.
Notes:
- The price of copper is moving up fast. This is being caused by buying out of China.
- China is a large importer of cooper. They import about 85 percent of their need.
- On December 24, copper traded at the low price of 124.75.
- Today the price was marked at 212.55.
- The price of copper has risen 70 percent in the last 4 months.
You should be looking at Freeport McMoran (FCX). Freeport benefits from rises in the price of copper. The company is also a large producer of gold. We will cover Freeport McMoran tommorow.
You should note the effect that demand from China can have on commodity prices. One theme that should become evident is that when China starts to demand the supply of a commodity its price is likely to rise dramatically. This will create lots of opportunites for smart investors.
There are several ways to take advantage of thirsty demand for commodities from China. These include: sector stocks, ETFs, options, and commodity futures contracts.
We will be honing in on these opportunities in the days and weeks ahead.
So stay tuned daily.
Subscribe to All American Investor via Email
| Bob DeMarco is a citizen journalist and twenty year Wall Street veteran. Bob has written more than 500 articles with more than 11,000 links to his work on the Internet. Content from All American Investor has been syndicated on Reuters, the Wall Street Journal, Fox News, Pluck, Blog Critics, and a growing list of newspaper websites. Bob is actively seeking syndication and writing assignments. |
Follow All American Investor on Twitter
Thursday, April 09, 2009
Imports from China Dropping Fast (Graph)
Imports from China

The above chart represents imports from China in millions, monthly. It is pretty obvious that imports from China are dropping. Today's report on Import/Exports showed that imports are still dropping. As a result, it is likely that imports from China are likely to continue dropping for the foreseeable future.
Why is this chart important? We will be relying on China to buy an enormous amount of Treasury securities in the years ahead. But, will they be able to accommodate our needs?
Frankly, this is worrisome. If this trend continues for a long period of time it could impact interest rates--dramatically.
Follow All American Investor on Twitter
The above chart represents imports from China in millions, monthly. It is pretty obvious that imports from China are dropping. Today's report on Import/Exports showed that imports are still dropping. As a result, it is likely that imports from China are likely to continue dropping for the foreseeable future.
Why is this chart important? We will be relying on China to buy an enormous amount of Treasury securities in the years ahead. But, will they be able to accommodate our needs?
Frankly, this is worrisome. If this trend continues for a long period of time it could impact interest rates--dramatically.
Subscribe to All American Investor via Email
| Bob DeMarco is a citizen journalist and twenty year Wall Street veteran. Bob has written more than 500 articles with more than 11,000 links to his work on the Internet. Content from All American Investor has been syndicated on Reuters, the Wall Street Journal, Fox News, Pluck, Blog Critics, and a growing list of newspaper websites. Bob is actively seeking syndication and writing assignments. |
Follow All American Investor on Twitter
Tuesday, April 07, 2009
The 15 Biggest Holders of U. S. Government Debt
Ever wonder who are the biggest holders of U. S. Government debt?
Maybe you are thinking China? Nope. Luxembourg is number 15 at a paltry $87.2 Billion.
The biggest? This entity owns $4.806 Trillion.
Take a look at the slide show to see the 15 biggest holders.
Maybe you are thinking China? Nope. Luxembourg is number 15 at a paltry $87.2 Billion.
The biggest? This entity owns $4.806 Trillion.
Take a look at the slide show to see the 15 biggest holders.
Subscribe to All American Investor via Email
Subscribe to:
Posts (Atom)