Showing posts with label gdp. Show all posts

Thursday, August 29, 2013

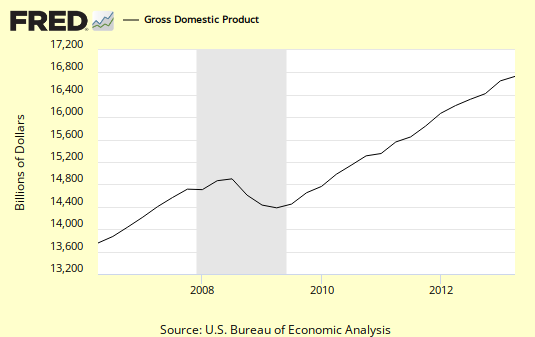
Gross Domestic Product (GDP) Q2 2013


2013:Q2: 16,667.9 Billions of Dollars

All American Investor

Wednesday, June 26, 2013

National Income and Product Accounts Gross Domestic Product


Real gross domestic product -- the output of goods and services produced by labor and property located in the United States -- increased at an annual rate of 1.8 percent in the first quarter of 2013 (that is, from the fourth quarter to the first quarter), according to the "third" estimate released by the Bureau of Economic Analysis. 

 In the fourth quarter, real GDP increased 0.4 percent.

Friday, May 31, 2013

Gross Domestic Product, 1 Decimal (GDP) 2013:Q1


16,004.5 Billions of Dollars

Graph of Gross Domestic Product, 1 Decimal

Gross domestic product (GDP), the featured measure of U.S. output, is the market value of the goods and services produced by labor and property located in the United States. 

For more information, see the Guide to the National Income and Product Accounts of the United States (NIPA) - (http://www.bea.gov/national/pdf/nipaguid.pdf)


Original content +Bob DeMarco , All American Investor

Sunday, June 07, 2009

Total Consumer Credit Outstanding Continues to Drop (Graph)


As you can see from the graph, Total Consumer Credit Outstanding Continues to Drop. This is an unusual pattern. After nine months down, we are now back to a level last seen during December, 2007.

If the trend continues at this pace, it will have a negative impact on GDP in the months ahead. This will certainly have an impact on future economic forecasts, consumption, and consumer spending.

Subscribe to All American Investor via Email

Bob DeMarco is a citizen journalist and twenty year Wall Street veteran. Bob has written more than 500 articles with more than 11,000 links to his work on the Internet. Content from All American Investor has been syndicated on Reuters, the Wall Street Journal, Fox News, Pluck, Blog Critics, and a growing list of newspaper websites. Bob is actively seeking syndication and writing assignments.


More from All American Investor

Kindle: Amazon's 6" Wireless Reading Device


Follow All American Investor on Twitter

Wednesday, May 13, 2009

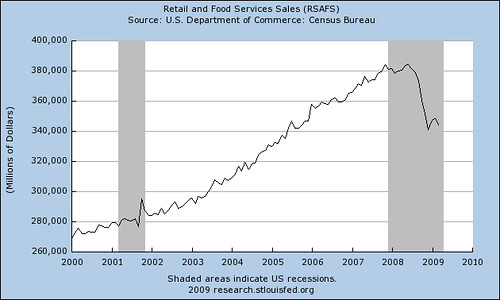
Retail Sales a Picture Worth a Thousand Words--UGH (Chart)


Retail sales dropped .4 percent for the month and are down 10.1 percent year over year. Retail sales account for two thirds of GDP. This report is bearish on the market.

There is a strong relationship between GDP and stocks. This report really puts pressure on relative valuations. The risk of owning stocks is mounting as we pointed out last week in our article --They called me crazy, S and P 900-1000 (Part Two)
  • A major retracement to the downside is likely, and is imminent.
  • The bottom line. The risks out weigh the rewards at this level.
The S and P was trading near 925 when we wrote that. Now down 4 percent.

We will update the S and P numbers shortly.


Subscribe to All American Investor via Email
Bob DeMarco is a citizen journalist and twenty year Wall Street veteran. Bob has written more than 500 articles with more than 11,000 links to his work on the Internet. Content from All American Investor has been syndicated on Reuters, the Wall Street Journal, Fox News, Pluck, Blog Critics, and a growing list of newspaper websites. Bob is actively seeking syndication and writing assignments.


Follow All American Investor on Twitter

Wednesday, April 29, 2009

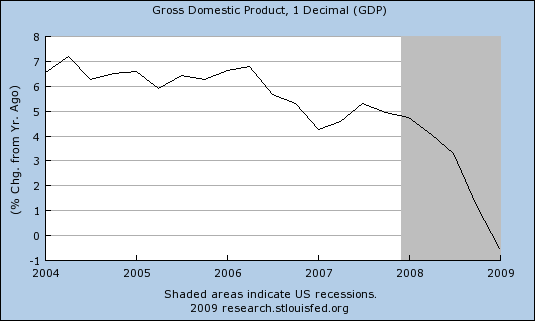
GDP Still Trending Down (Graph)


This is a different look at GDP. 

The chart shows GDP as percent change from a year ago. The trend is clearly down. This chart shows a different picture than looking at quarterly change, and comparing GDP numbers quarter by quarter. 

The quarterly chart shows GDP improving from down 6.3 percent, to down 6.1 percent. A quick look at those numbers could easily lead one to believe that GDP is improving.  Is down 6.1 percent really better than down 6.3 percent?

Keep in mind, retail sales make up about two thirds of GDP.

GDP Pecent Change 429
Subscribe to All American Investor via Email


Follow All American Investor on Twitter

Gross Domestic Product Drops 6.1 Percent


Real gross domestic product -- the output of goods and services produced by labor and property located in the United States -- decreased at an annual rate of 6.1 percent in the first quarter of 2009, (that is, from the fourth quarter to the first quarter), according to advance estimates released by the Bureau of Economic Analysis. In the fourth quarter, real GDP decreased 6.3 percent.

The price index for gross domestic purchases, which measures prices paid by U.S. residents, decreased 1.0 percent in the first quarter, compared with a decrease of 3.9 percent in the fourth. Excluding food and energy prices, the price index for gross domestic purchases increased 1.4 percent in the first quarter, compared with an increase of 1.2 percent in the fourth. The federal pay raise for civilian and military personnel added 0.3 percentage point to the change in the first quarter gross domestic purchases price index.
Subscribe to All American Investor via Email
Bob DeMarco is a citizen journalist and twenty year Wall Street veteran. Bob has written more than 500 articles with more than 11,000 links to his work on the Internet. Content from All American Investor has been syndicated on Reuters, the Wall Street Journal, Fox News, Pluck, Blog Critics, and a growing list of newspaper websites. Bob is actively seeking syndication and writing assignments.

Real personal consumption expenditures increased 2.2 percent in the first quarter, in contrast to a decrease of 4.3 percent in the fourth. Durable goods increased 9.4 percent, in contrast to a decrease of 22.1 percent. Nondurable goods increased 1.3 percent, in contrast to a decrease of 9.4 percent. Services increased 1.5 percent, the same increase as in the fourth.

Real nonresidential fixed investment decreased 37.9 percent in the first quarter, compared with a decrease of 21.7 percent in the fourth. Nonresidential structures decreased 44.2 percent, compared with
a decrease of 9.4 percent. Equipment and software decreased 33.8 percent, compared with a decrease of 28.1 percent. Real residential fixed investment decreased 38.0 percent, compared with a decrease of 22.8 percent.

Real exports of goods and services decreased 30.0 percent in the first quarter, compared with a decrease of 23.6 percent in the fourth. Real imports of goods and services decreased 34.1 percent, compared with a decrease of 17.5 percent.

Real federal government consumption expenditures and gross investment decreased 4.0 percent in the first quarter, in contrast to an increase of 7.0 percent in the fourth. National defense decreased 6.4 percent, in contrast to an increase of 3.4 percent. Nondefense increased 1.3 percent, compared with an increase of 15.3 percent. Real state and local government consumption expenditures and gross
investment decreased 3.9 percent, compared with a decrease of 2.0 percent.

The real change in private inventories subtracted 2.79 percentage points from the first-quarter
change in real GDP after subtracting 0.11 percentage point from the fourth-quarter change. Private businesses decreased inventories $103.7 billion in the first quarter, following decreases of $25.8 billion in the fourth quarter and $29.6 billion in the third.

Real final sales of domestic product -- GDP less change in private inventories -- decreased 3.4 percent in the first quarter, compared with a decrease of 6.2 percent in the fourth.


Gross domestic purchases

Real gross domestic purchases -- purchases by U.S. residents of goods and services wherever produced -- decreased 7.8 percent in the first quarter, compared with a decrease of 5.9 percent in the fourth.


Disposition of personal income

Current-dollar personal income decreased $59.9 billion (2.0 percent) in the first quarter, compared with a decrease of $42.9 billion (1.4 percent) in the fourth.

Personal current taxes decreased $193.5 billion in the first quarter, in contrast to an increase of $19.7 billion in the fourth.

Disposable personal income increased $133.6 billion (5.1 percent) in the first quarter, in contrast to a decrease of $62.6 billion (2.3 percent) in the fourth. Real disposable personal income increased 6.2 percent, compared with an increase of 2.7 percent.

Personal outlays increased $18.1 billion (0.7 percent) in the first quarter, in contrast to a decrease of $260.2 billion (9.5 percent) in the fourth. Personal saving -- disposable personal income less personal outlays -- was $453.0 billion in the first quarter, compared with $337.4 billion in the fourth. The personal saving rate -- saving as a percentage of disposable personal income -- was 4.2 percent in the first quarter, compared with 3.2 percent in the fourth. For a comparison of personal saving in BEA’s national income and product accounts with personal saving in the Federal Reserve Board’s flow of funds accounts and data on changes in net worth, go to http://www.bea.gov/bea/dn/nipaweb/Nipa-Frb.asp.


Current-dollar GDP

Current-dollar GDP -- the market value of the nation's output of goods and services -- decreased 3.5 percent, or $124.8 billion, in the first quarter to a level of $14,075.5 billion. In the fourth quarter, current-dollar GDP decreased 5.8 percent, or $212.5 billion.


Follow All American Investor on Twitter

Thursday, April 16, 2009

China’s Economy Grows 6.1%, Inflation next?


China’s economy grew 6.1% in the first quarter, that is the good news. The bad news? The Chinese economy grew at the slowest pace in almost a decade. We can only wish.

The important news is that China's industrial production grew 8.3% during March up from 3.8 percent in the first two months. Retail sales rose 14.7%.

The real news here is that commodity prices are going to start rising due to Chinese demand. We already showed the effect, two days ago, on Chinese demand for copper and how it is causing the price of copper to rise sharply.

I continue to encourage investors to get into stocks that will benefit from rising inflation. We will discuss more of these in the days ahead.

I have mentioned the ETF, MOO, several times on this website in the past. This is a good example of a stock that benefits from inflation. We will also be discussing Freeport McMoran (FCX), which we mentioned a few days ago.

We will be discussing good inflation stocks in the days ahead, so remember to stay tune in for those ideas.
Subscribe to All American Investor via Email

Bob DeMarco is a citizen journalist and twenty year Wall Street veteran. Bob has written more than 500 articles with more than 11,000 links to his work on the Internet. Content from All American Investor has been syndicated on Reuters, the Wall Street Journal, Fox News, Pluck, Blog Critics, and a growing list of newspaper websites. Bob is actively seeking syndication and writing assignments.


Kindle 2: Amazon's New Wireless Reading Device (Latest Generation)


Follow All American Investor on Twitter
Tuesday, April 14, 2009

Retail Sales Plummet (Graph)


Retail Sales, Monthly, Not Seasonally Adjusted

Retail Sales 414

Retail sales account for two thirds of GDP, so this report is definitely disconcerting.
Subscribe to All American Investor via Email


Follow All American Investor on Twitter

Wednesday, April 01, 2009

China's 2009 GDP Likely to Hit 7%


Although Jong-Wha Lee, acting chief economist at the Asian Development Bank foresees China's GDP hitting 7% this year, he believes its economy may be able to achieve 8% growth in 2010.


Subscribe to All American Investor via Email

Friday, March 27, 2009

Personal Income and Expenditures (Numbers and Charts)


Personal Consumption Expenditures tick up. A positive factor for first Quarter GDP.


Personal income
  • decreased $29.1 billion, or 0.2 percent
  • disposable personal income (DPI) decreased $10.5 billion, or 0.1 percent

Personal consumption expenditures (PCE)
  • increased $17.2 billion, or 0.2 percent. In January, personal
  • income increased $20.5 billion, or 0.2 percent
  • DPI increased $164.6 billion, or 1.6 percent
  • PCE increased $94.8 billion, or 1.0 percent, based on revised estimates.
Real disposable income
  • decreased 0.4 percent in February, in contrast to an increase of 1.3 percent in January.
Real PCE
  • decreased 0.2 percent, in contrast to an increase of 0.7 percent.
  • The price index for PCE increased 0.3 percent, the same increase as in January.

Source: Bureau of Economic Analysis (more details and pres release)

Subscribe to All American Investor via Email

Disposable Personal Income ticks up.


Bob DeMarco is a citizen journalist and twenty year Wall Street veteran. Bob has written more than 500 articles with more than 11,000 links to his work on the Internet. Content from All American Investor has been syndicated on Reuters, the Wall Street Journal, Fox News, Pluck, Blog Critics, and a growing list of newspaper websites. Bob is actively seeking syndication and writing assignments.


Follow All American Investor on Twitter


Friday, March 13, 2009

Over Leveraged American Consumer Needs the Big Inflation


Yesterday's big headline was about the 18 percent drop in Household net worth in 2008. Amazingly, household net worth dropped by $11 trillion. This effect was caused by the double whammy--drops in both the price of homes and the stock market.

I found this interesting chart over at Calculated Risk.


The chart shows Household Net Worth as a percent of GDP. If you look closely you will notice three things.
  • The first big spike up in household net worth occurred during the Internet stock bubble (1996-2000).
  • The second big spike up in household net worth occurred when both stocks and housing prices were rising fast (late 2002- late 2007).
  • And third, the trend since 1952 is for household net worth to range between 300-350 percent of GDP.
What we are seeing here is the bubble bursting and overall net worth returning to a more normalized state. So while consumers might be feeling "poor" at the moment--in historical terms--this is not true.
Subscribe to All American Investor via Email

Today, I am reading about Household Debt as a Percent of GDP in the Wall Street. This chart is more worrisome.


When you marry the information on these two charts you can come to a simple conclusion--much of the increase in household net worth was fueled by the taking on of debt by consumers. We have been reading about the over leveraging of companies like Bear Stearns, Lehman Brothers, and AIG; but, not so much about the over leveraging of the American consumer. What is true is that consumers experienced a short term burst in net worth that was fueled by debt. But, now these debts need to be repaid and the consumer will no longer be able to borrow from "peter" to pay "paul". In other words, consumers won't be able to refinance their home and take the proceeds and spend them on houses and cars. They will now have to pay down the debt the old fashioned way.

It should be clear, after looking at these two charts that Household Net Worth has already corrected to a more normalized level--this is a good thing. It should be clear that consumers have a long way to go before they reach the point of more normal leverage on their personnel balance sheets. Many consumers are leveraged beyond their means. Not a good thing.

Retail sales account for two thirds of GDP. It should be clear that consumers are going to need to reduce debt before they can get back to buying houses, cars, and stocks. This means that it is going to be a long time before we see a return to robust gains in the GDP. Not a good thing.

Superimpose on top of these charts: rising unemployment and the sharp rise in government spending. As financial institutions deleverage and consumers face a long period of deleveraging--the government is leveraging up its balance sheet. Another credit bubble waiting to burst? Not a good thing, although necessary.

My guess is that a year or two down the road we will see the stresses from this new bubble--government spending. This will occur as the government finds difficultly financing its debt in the world markets, consumers start to default on credit cards in greater numbers, and the reality that there is no short term fix to a problem that has been building since the early 1980s.

Inflation is a likely to rear its ugly head soon, see (Reserve Balances held by the Federal Reserve Bank are going off the chart). Actually a good thing if you are in debt. You pay back debt with cheaper dollars. This reminded me that I started paying on my student loans in 1978. Loans I took out while I was in college and started paying after graduate school. When I made my last payment in 1988, I was paying with dollars that were worth about one third of what they were worth when I borrowed them (value of a dollar 1988 versus 1970). You might think to yourself right here--big inflation is the way out of this trap. Seems right to me.

My final advice here is straightforward--don't get carried away by the madness of the crowd. You will have plenty of time to buy great stocks at low prices.

Special thanks to Calculated Risk--Fed: Household Net Worth Cliff Dives in Q4, and the Wall Street Journal--Is Debt Ready for a Dive? Both articles are worth reading and considering.

Bob DeMarco is a citizen journalist and twenty year Wall Street veteran. Bob has written more than 500 articles with more than 11,000 links to his work on the Internet. Content from All American Investor has been syndicated on Reuters, the Wall Street Journal, Fox News, Pluck, Blog Critics, and a growing list of newspaper websites. Bob is actively seeking syndication and writing assignments.

Follow All American Investor on Twitter
More from All American Investor


Sunday, March 08, 2009

Wall Street on the Tundra --Michael Lewis


Michael Lewis is at it again with this long but interesting article in Vanity Fair--Wall Street on the Tundra.
Iceland’s de facto bankruptcy—its currency (the krona) is kaput, its debt is 850 percent of G.D.P., its people are hoarding food and cash and blowing up their new Range Rovers for the insurance—resulted from a stunning collective madness. What led a tiny fishing nation, population 300,000, to decide, around 2003, to re-invent itself as a global financial power? In Reykjavík, where men are men, and the women seem to have completely given up on them, the author follows the peculiarly Icelandic logic behind the meltdown.
by Michael Lewis April 2009
Subscribe to All American Investor via Email


Follow us on Twitter

Bob DeMarco is a citizen journalist, blogger, and Caregiver. In addition to being an experienced writer he taught at the University of Georgia , was an Associate Director and Limited Partner at Bear Stearns, was CEO of IP Group, and is a mentor. Bob currently resides in Delray Beach, FL where he cares for his mother, Dorothy, who suffers from Alzheimer's disease. Bob has written more than 500 articles with more than 11,000 links to his work on the Internet. His content has been syndicated on Reuters, the Wall Street Journal, Fox News, Pluck, Blog Critics, and a growing list of newspaper websites. Bob is actively seeking syndication and writing assignments.


More from All American Investor


Monday, March 02, 2009

Merrill goes negative on global GDP growth


Subscribe to All American Investor via Email

Friday, February 27, 2009

Economists question budget's economic assumptions


Does anyone really know?
GDP plays the biggest role in determining the accuracy of deficit forecasts because weaker-than-expected growth swells government payments for such things as unemployment benefits and food stamps and reduces tax receipts.
True.
In its budget, the administration predicted that the overall economy, as measured by the gross domestic product, will shrink by 1.2 percent this year but will grow by a solid 3.2 percent in 2010. That growth would be followed by even stronger increases of 4 percent in 2011, 4.6 percent in 2012 and 4.2 percent in 2013.
Impossible to predict.
By contrast, the consensus of forecasters surveyed by Blue Chip Economic Indicators in February predicted that the GDP will fall by a larger 1.9 percent this year and then increase at weaker rates of 2.1 percent in 2010, 2.9 percent in 2011 and 2012 and 2.8 percent in 2013.
Everybody has an opinion.
"When a country is griped by a financial crisis, the ensuing downturn often lasts much longer than normal," said Sung Won Sohn, an economics professor at the Martin Smith School of Business at California State University. "I think this downturn is gong to last longer and the rebound will be fairly anemic."
Trends tend to persist.
But Mark Zandi, chief economist at Moody's Economy.com, said he believed the extent of the downturn will be more severe than the administration's forecast for this year and that this will prompt even larger policy responses on the part of the government, including increased help for homeowners facing foreclosure and another stimulus from Congress a year from now.
This guy is really smart, I bet even he hopes he is wrong.

Conclusion. Stocks going lower.

Source: Economists question budget's economic assumptions
Subscribe to All American Investor via Email
Follow us on Twitter

Bob DeMarco is a citizen journalist, blogger, and Caregiver. In addition to being an experienced writer he taught at the University of Georgia , managed on Wall Street at Bear Stearns, was CEO of IP Group, and is a mentor. Bob currently resides in Delray Beach, FL where he cares for his mother, Dorothy, who suffers from Alzheimer's disease. Bob has written more than 500 articles with more than 11,000 links to his work on the Internet. His content has been syndicated on Reuters, the Wall Street Journal, Fox News, Pluck, BlogCritics, and a growing list of newspaper websites (15). Bob is actively seeking writing assignments and syndication.


More from All American Investor


Tuesday, February 24, 2009

Is saving the answer to our economic problems--Paradox Squared


I believe savings is the answers to our economic woes. I wrote about this previously on this blog.

Our government policy makers seem to think the opposite is true. George Bushs' solution to our problems was to tell us to "go shopping". Later he tried to get everyone to go shopping by sending them a stimulus check. My mother put hers in the bank. She will put the next stimulus check she is getting in May--in the bank. She is 92 and lived through the "last" depression. Don't get me wrong, she still likes to buy new cloths and likes to go out and have fun on Friday night. But, at the age of 92 you tend to think like a squirrel and not like a rabbit.

I ran across a really intriguing article by Paul Kasriel--Paradox Squared. Here is a snippet from the last paragraph of the article.
The most rapid real GDP growth we experienced in the 1951 through 2008 period occurred in the 1960s, a period when the consumption ratio was relatively low. My bet is that when we come out of this current deep recession (Q4:2009?), the recovery and expansion will be accompanied by a much lower consumption ratio than we have experienced in recent years and higher export and business capital spending ratios than we have experienced in recent years. But most importantly, I expect that these changing ratios will be accompanied by higher growth in real GDP ex federal government than we have experienced in recent years. Why? Because, as I stated at the outset, the pace of economic growth is a function of productivity and thrift. And no less an authority than the editor of Vogue says that thrift is in vogue again!
I believe savings is in vogue right now. I also think savings leads to investment which leads to economic growth.

I wonder what Larry Kudlow would have to say about this?

To read the complete article--Paradox Squared--and see the accompanying chart go here. This is worth reading and considering. If nothing else it is pleasant to think there could be a light at the end of the tunnel.

That is my 92 year old mother, Dorothy, up there on the right. Looks pretty good for her age--don't you think?
Subscribe to All American Investor via Email


More from All American Investor


Friday, February 13, 2009

Economy continues to worsen and so do forecasts


Economist forecast of GDP continues to worsen. This does not bode well for stocks near term. Has the market already discounted these forecast? This is a big question right now. The effects of the stimulus plan are not likely to help near term. Housing continues to worsen and the toxic time bomb of Option Arm mortgages is still hovering over the housing market and the economy. How high will unemployment rise? If it exceeds ten percent what effect will this have on investor psychology?


"We're in trouble," Mr. Fabbri said. "We don't have sufficient economic plans at present to resolve the banking system or the financial crisis, and the stimulus package seems loaded for 2010." He added that the global nature of the downturn along with U.S. consumers' increased saving and lenders' tightened standards all stand in the way of a quick recovery.
Mr. Shapiro, who has been bearish on 2009 for months, sees unemployment hitting nearly 10% by year end and says he expects the economy to shrink through 2010. "We just think the enormity of the problem is not recognized by most people," he said. "If you look at the magnitude of this problem, the amount of debt relative to income, the credit and asset bubbles that have now reversed and it's only just started, why is it going to end two quarters from now?"


Subscribe to All American Investor via Email
Economists' U.S. Outlook Dims
By KELLY EVANS and PHIL IZZO

Economists in the latest Wall Street Journal forecasting survey still mostly project growth in U.S. gross domestic product by the third quarter, but they largely agree that a 2009 "second-half recovery" -- a widely shared scenario until now -- is looking much less likely.

Recent data showing just how sharply growth in the U.S. and elsewhere has declined in the final months of 2008 have cast a deepening shadow over 2009.

As recently as September, economists on average thought the U.S. would see annualized GDP growth of 1.2% in the first three months of this year; now, they see a 4.6% decline. Forecasts for the April-through-June period have seen a similar shift, from a 1.9% growth forecast to now a 1.5% decline, based on the 52 economists who participated in the Journal's February survey.

The average forecast is for growth in the third quarter at 0.7%, less than half the rate expected last fall. The fourth-quarter picture has also darkened, but just slightly, to growth of 1.9% from 2.1% seen in November. Only five economists see growth declining through the fourth quarter of 2009; but they insist the consensus outlook right now, which says the recession will end in August as GDP returns to growth, is far too optimistic.

"The consensus is usually late to the party," said Brian Fabbri, chief economist at BNP Paribas, noting he was one of the few who forecast the current recession two years ago. Now, he is one of the five who sees GDP declining through the end of 2009, along with Joshua Shapiro, chief U.S. economist at forecasting firm MFR Inc.; Paul Ashworth of Capital Economics; Swiss Re chief economist Kurt Karl; and retired Vanderbilt University professor J. Dewey Daane.

"We're in trouble," Mr. Fabbri said. "We don't have sufficient economic plans at present to resolve the banking system or the financial crisis, and the stimulus package seems loaded for 2010." He added that the global nature of the downturn along with U.S. consumers' increased saving and lenders' tightened standards all stand in the way of a quick recovery.

A boost to the economy from the government stimulus package has been a key feature of most forecasts for a rosy finish to 2009, but economists in the February survey largely expressed disappointment with how the package is shaping up. Comments on the package's influence this year say it is "too late," "provides little boost," is "trivial," "too big," "too small" and a "colossal waste of money." Nicholas Perna of Perna Associates cautioned, "We're in danger of repeating Japan's mistakes," referring to that nation's policy errors during its "lost decade" of the 1990s.
About the Survey

The Wall Street Journal surveys a group of 55 economists throughout the year. Broad surveys on more than 10 major economic indicators are conducted every month. Once a year, economists are ranked on how well their forecasts have fared. For prior installments of the surveys, see: WSJ.com/Economist.

Forecasters also were asked how many jobs they expect the U.S. to lose in 2009, and the average response called for a loss of nearly 183,000 a month. But when asked how that would look absent the stimulus package, they saw a loss on average of about 271,000 a month. Employment often lags behind changes in economic growth, and if the labor market behaves as it has during the past two recessions, job losses and unemployment will likely rise for many months after GDP returns to growth. On average, economists see unemployment hitting 8.8% by December, from its current 7.6%.

Mr. Shapiro, who has been bearish on 2009 for months, sees unemployment hitting nearly 10% by year end and says he expects the economy to shrink through 2010. "We just think the enormity of the problem is not recognized by most people," he said. "If you look at the magnitude of this problem, the amount of debt relative to income, the credit and asset bubbles that have now reversed and it's only just started, why is it going to end two quarters from now?"

"To say 'off we go' in the second half of the year, I think that begs incredulity, I just don't buy it," he said. "It's a global thing, too; trade volumes are just cratering and our exports are getting pounded. There's nowhere to hide."
video
Forecasters: 2009 Economic Rebound Unlikely
2:27

WSJ.com Editor Phil Izzo speaks to reporter Kelly Evans about the latest economic survey forecast. Analysts believe a recovery is unlikely until after 2009.

But others are standing by their forecasts for a second-half recovery. Joseph Carson, an economist with AllianceBernstein, says uncertainty about government policy is holding back risk-taking behavior -- for now. "Once we get clarity on the fiscal and financial packages, those two things together could end up jump-starting the economy," he said. He forecasts GDP will decline at a 3% rate in the current three months, then return to growth by April and surge to a 5.7% annualized pace in the closing months of the year. Other bulls include Brian Wesbury of First Trust Advisors and James Smith, a professor at Western Carolina University, who both see GDP growing at a 4% rate by year end.

Write to Kelly Evans at kelly.evans@wsj.com and Phil Izzo at philip.izzo@wsj.com

More on All American Investor


Friday, January 30, 2009

Global Economy Grinding to a Halt


The International Monetary Fund (IMF) is now forecasting the global economy to grow at one half of one percent (.5%) in 2009. This is stunning news. Just two months ago the same group was forecasting annual growth at 2.2 percent. Olivier Blanchard, the IMF's chief economist offered these sobering words:
"We expect the global economy to come to a virtual standstill in 2009."
The situation in China continues to deteriorate as growth is forecast an annual rate of 6.7% about half the growth rate they reported in 2007. The forecast of 6.7 percent is suspect due to the way the numbers are calculated in China. One can only wonder if their is a "silent" backlash toward China brewing in the U.S. Helping foster the growing negative attitude in China yesterday Vice President Joe Biden said:
the U.S. would be “blunter with the Chinese” and that China must “play by the rules.”
The U. S. long term bond market reacted by dropping a whopping three points.

In a seperate report the IMF forecast that
financial institutions face much larger losses on U.S. securities than foreseen just weeks ago. Losses now are expected to reach $2.2 trillion, up from the $1.4 trillion estimated last fall.
This can only be regarded as more bad news in the financial sector.

The IMF is predicting that in order to prevent further deterioration in their ability to lend, major U.S. and European banks require an additional $500 billion in new capital, the report said. One can only wonder how these enormous capital needs are going to be met.

This news does not bode well for equities world wide. It is not likely that these continued dire forecasts have been digested into the equity market. And worse, most forecast continue to become more dire with each new release.
Subscribe to All American Investor via Email