Showing posts with label forecast. Show all posts

Friday, April 24, 2009

Roubini: Economist Forecast on Economy Optimistic


Mild signs that the rate of economic contraction is slowing in the United States, China and other parts of the world have led many economists to forecast that positive growth will return to the US in the second half of the year, and that a similar recovery will occur in other advanced economies.

The emerging consensus among economists is that growth next year will be close to the trend rate of 2.5 per cent.
This consensus optimism is, I believe, not supported by the facts. Indeed, I expect that while the rate of US contraction will slow from -6 per cent in the last two quarters, US growth will still be negative (around -1.5 to -2 per cent) in the second half of the year (compared to the bullish consensus of +2 per cent).


Subscribe to All American Investor via Email

End of Economic Gloom? Not as Early as You Wish. Roubini’s latest Article for Project Syndicate

End of economic gloom? Nouriel Roubini

Mild signs that the rate of economic contraction is slowing in the United States, China and other parts of the world have led many economists to forecast that positive growth will return to the US in the second half of the year, and that a similar recovery will occur in other advanced economies.

The emerging consensus among economists is that growth next year will be close to the trend rate of 2.5 per cent.

Investors are talking of 'green shoots' of recovery and of positive 'second derivatives of economic activity' (continuing economic contraction is the first, negative, derivative, but the slower rate suggests that the bottom is near).

As a result, stock markets have started to rally in the US and around the world. Markets seem to believe that there is light at the end of the tunnel for the economy and for the battered profits of corporations and financial firms.

This consensus optimism is, I believe, not supported by the facts. Indeed, I expect that while the rate of US contraction will slow from -6 per cent in the last two quarters, US growth will still be negative (around -1.5 to -2 per cent) in the second half of the year (compared to the bullish consensus of +2 per cent).

Moreover, growth next year will be so weak (0.5 to 1 per cent, as opposed to the consensus of 2 per cent or more) and unemployment so high (above 10 per cent) that it will still feel like a recession.

In the euro zone and Japan, the outlook for 2009 and 2010 is even worse, with growth close to zero even next year. China will have a more rapid recovery later this year, but growth will reach only 5 per cent this year and 7 per cent in 2010, well below the average of 10 per cent over the last decade.

Given this weak outlook for the major economies, losses by banks and other financial institutions will continue to grow. My latest estimates are $3.6 trillion in losses for loans and securities issued by US institutions, and $1 trillion for the rest of the world.

It is said that the International Monetary Fund, which earlier this year revised upward its estimate of bank losses, from $1 trillion to $2.2 trillion, will announce a new estimate of $3.1 trillion for US assets and $0.9 trillion for foreign assets, figures very close to my own.

By this standard, many US and foreign banks are effectively insolvent and will have to be taken over by governments. The credit crunch will last much longer if we keep zombie banks alive despite their massive and continuing losses.

Given this outlook for the real economy and financial institutions, the latest rally in US and global stock markets has to be interpreted as a bear-market rally. Economists usually joke that the stock market has predicted 12 out of the last nine recessions, as markets often fall sharply without an ensuing recession.

But, in the last two years, the stock market has predicted six out of the last zero economic recoveries -- that is, six bear market rallies that eventually fizzled and led to new lows.

The stock market's latest 'dead cat bounce' may last a while longer, but three factors will, in due course, lead it to turn south again. First, macroeconomic indicators will be worse than expected, with growth failing to recover as fast as the consensus expects.

Second, the profits and earnings of corporations and financial institutions will not rebound as fast as the consensus predicts, as weak economic growth, deflationary pressures and surging defaults on corporate bonds will limit firms' pricing power and keep profit margins low.

Third, financial shocks will be worse than expected.

At some point, investors will realise that bank losses are massive, and that some banks are insolvent. Deleveraging by highly leveraged firms -- such as hedge funds -- will lead them to sell illiquid assets in illiquid markets. And some emerging market economies -- despite massive IMF support -- will experience a severe financial crisis with contagious effects on other economies.

So, while this latest bear-market rally may continue for a bit longer, renewed downward pressure on stocks and other risky assets is inevitable.

To be sure, much more aggressive policy action (massive and unconventional monetary easing, larger fiscal-stimulus packages, bailouts of financial firms, individual mortgage-debt relief, and increased financial support for troubled emerging markets) in many countries in the last few months has reduced the risk of a near depression. That outcome seemed highly likely six months ago, when global financial markets nearly collapsed.

Still, this global recession will continue for a longer period than the consensus suggests. There may be light at the end of the tunnel -- no depression and financial meltdown. But economic recovery everywhere will be weaker and will take longer than expected. The same is true for a sustained recovery of financial markets.

Nouriel Roubini is professor of economics at the Stern School of Business, New York University, and chairman of RGE Monitor. Copyright: Project Syndicate, 2009.

Access to some RGE EconoMonitors, including Nouriel Roubini's Global EconoMonitor, is reserved for registered users, so sign up now to read and comment on current postings. These writings are only a small part of the insights and commentary available through RGE Monitor. Contact us today at info@rgemonitor.com or 212.645.0010 to learn more about becoming a full subscriber.
Go Check it Out.

Bob DeMarco is a citizen journalist and twenty year Wall Street veteran. Bob has written more than 500 articles with more than 11,000 links to his work on the Internet. Content from All American Investor has been syndicated on Reuters, the Wall Street Journal, Fox News, Pluck, Blog Critics, and a growing list of newspaper websites. Bob is actively seeking syndication and writing assignments.


More from All American Investor


Follow All American Investor on Twitter

Thursday, March 26, 2009

S and P Chart Healthy and Congested


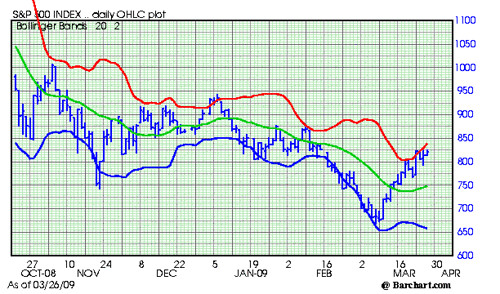
S and P 500 Cash, Chart, March 26.

S an P 500 Chart 326


This S and P chart continues to show that technical resilience is building. The S and P is still in a range expansion and this indicates that volatility could pick up at any time. The red line (plus two standard deviations) is sloping up and the market is continuing to hug the line. All short term positives.

The other day we mentioned that there was considerable resistance and congestion in the 825 area. The market continues trying to attack this area. There is more upside potential on a short term basis then we had a few days ago, now up to the 850 area. Good support is down around 750 and is rising.

Bulls should be a bit cautious right now. If the market can't get firmly through 825 soon, the market might be ripe for a further test of the downside to establish support.

Short term still looks good to me.


Subscribe to All American Investor via Email


Bob DeMarco is a citizen journalist and twenty year Wall Street veteran. Bob has written more than 500 articles with more than 11,000 links to his work on the Internet. Content from All American Investor has been syndicated on Reuters, the Wall Street Journal, Fox News, Pluck, Blog Critics, and a growing list of newspaper websites. Bob is actively seeking syndication and writing assignments.

Follow All American Investor on Twitter
More from All American Investor


Wednesday, March 25, 2009

They called me crazy, S and P 900-1000


On Sunday, I wrote an article on this blog entitled, Stocks Don't Fight the Tape.

In the article I wrote the following,
My guess is that we are going to have one monster rally shortly. I could envision the market on the S and P 500 soaring up to 900 or 1000. That would qualify as one heck of a rally.
When I wrote that article the S and P 500 was at 768.54.

On the open yesterday, I pointed out that the S and P 500 chart indicated the market was overbought. The S and P was hitting its red line (two standard deviations above the mean). The statistical odds always favor a pullback when that happens. The other point I was making, was that, the market now has some good technical resilience. This is a necessary component before a market can get into a healthy uptrend.

Just so you won't think I am some kind of all the time bulldog, you can go read an article I wrote on this blog when I was nutsy bearish back in September--Financial Meltdown--Where there is Smoke, there is Fire. I concluded that article by saying, "cash was king". At the time, the S and P 500 was well above 1200.

This investment blog is relatively new. I am seeking more subscribers (free). If you think this is worthwhile please subscribe. And then, tell your friends. Thanks.

The purpose here is to keep you thinking and help you make good decisions. On occasion you will find some gems like, Don't Fight the Tape.
Subscribe to All American Investor via Email
Bob DeMarco is a citizen journalist and twenty year Wall Street veteran. Bob has written more than 500 articles with more than 11,000 links to his work on the Internet. Content from All American Investor has been syndicated on Reuters, the Wall Street Journal, Fox News, Pluck, Blog Critics, and a growing list of newspaper websites. Bob is actively seeking syndication and writing assignments.

Tuesday, March 24, 2009

S and P 500 Attacking the Red LIne (Chart)


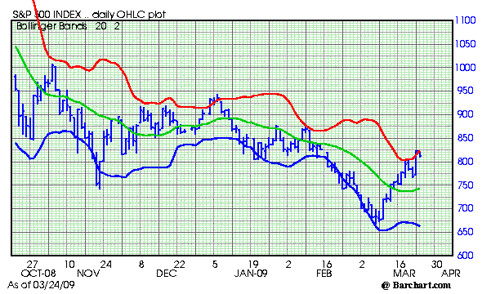
The rally in the S and P 500 the last two weeks has been nothing short of spectacular.

S and P 500 Chart 324


If you take a good look at the chart you will notice that the S and P bounced off the red line on March 18, 19. The red line should be considered resistance, and trades over that line are often met with resistance. The red line is the two standard deviation barrier.

Once again, we are bouncing off the line. So today looks like a day of rest. The red line is now sloping up fast, and short term we are in a range expansion. The market will have additional upside potential in the days ahead. However, if you look across the chart, all the way back to October, you will notice there is a lot of congestion in the 825 area.

Sooner or later, the market will back up and test some lower resistance. This is when the market will prove itself or fail. I understand that people are anxious to get their money back. However, since the bottom occurred, the market has not had a correction or any serious test of prices on the down side.

To become a comfortable bull, it is necessary to see the market probe lower levels and hold. Once good support areas can be identified, it is much easier for traders to add support to the market by buying againsst those support levels.

It is too early to tell if this is a correction in a bear market, or the turn in the market. The market still needs to prove on drops that there are buyers in waiting.

It is a good time to be patient. The market does look good on a short term basis right now.
Subscribe to All American Investor via Email


Bob DeMarco is a citizen journalist and twenty year Wall Street veteran. Bob has written more than 500 articles with more than 11,000 links to his work on the Internet. Content from All American Investor has been syndicated on Reuters, the Wall Street Journal, Fox News, Pluck, Blog Critics, and a growing list of newspaper websites. Bob is actively seeking syndication and writing assignments.


Follow All American Investor on Twitter
Thursday, March 19, 2009

Gold Shock and Awe (Chart)


April Gold 2009
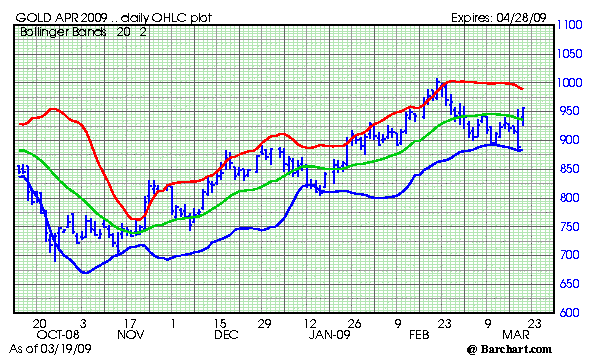
April Gold futures closed yesterday at 889.10 with a low of 882.70. Today it is trading in the 950 area. Clearly a major reaction to yesterday's news from the Federal Reserve Board. An impressive rally so far. Most gold stocks are up 5 percent or more today.

If you have been following along on this blog, you know I believe that gold is going higher--a lot higher. As a note of caution right now, gold has a very strong seasonal pattern, and we are entering the weakest part of the year. Gold has a tendency to peak in the February-March period and then bottom in the August-October period. I point this out so you know there is some downside risk at this time of year. If you own gold you need to be patient at this time of year.
If you look at the chart above you will notice that gold bottomed on October 24, 2008 at 734.60. This was down from over a 1000 in March of 2008.
The strong seasonal patterns in gold are due to buying patterns. Buying for jewelery, and buying out of China and India tend to be strong late in the year (I will explain this in a separate article soon).

There are three types of buying for gold: jewelry, industrial buying, and investment buying. In the last year, the jewelry component was down about 6 percent. Demand from investors rose more than 182 percent. In the fourth quarter when gold was rallying strongly demand was greater than supply (up 26 percent over the same quarter in 2007). I expect to see good buying out of China in the years ahead. I suspect the Central Bank of China will continue to add gold as a reserve. I also expect strong buying from investors. If the world economy picks up you can expect jewelry buying to increase. Inflation fears are likely to grow as the Federal Reserves continues to grow the monetary base through a never ending series of anti-deflation measures.

The above chart shows that gold continues to make higher highs and higher lows. The exception being yesterday when the market spiked down and right back up late yesterday and today.

On March 5, 2009, I wrote about Yamana Gold (AUY, $8.50). It is a good idea to look at Yamana. Other good ideas are: GLD (the ETF), GG (Goldcorp), FCX (Freeport-McMoRan Copper & Gold), ABX (Barrick Gold) and a long list of other gold stocks.

I will be writing more about gold, the fundamentals, supply and demand, seasonal trends, and gold stocks in the days ahead.
Subscribe to All American Investor via Email

Bob DeMarco is a citizen journalist and twenty year Wall Street veteran. Bob has written more than 500 articles with more than 11,000 links to his work on the Internet. Content from All American Investor has been syndicated on Reuters, the Wall Street Journal, Fox News, Pluck, Blog Critics, and a growing list of newspaper websites. Bob is actively seeking syndication and writing assignments.

Follow All American Investor on Twitter

Wednesday, March 11, 2009

Roubini on the U.S. Dollar


The following is from the email I received this morning from the RGE Monitor.

U.S. Dollar Outlook

After a brief rally in risky assets earlier this year, the dollar has resumed its safe haven status once more. Dollar shortages for funding needs and deleveraging of cross-border USD-denominated liabilities is also still providing juice for the dollar against G10 currencies (except yen and Swiss franc). Against the euro, the U.S. dollar will likely remain strong in the near-term on expected ECB rate cuts, intensifying Eastern European financial turmoil and Eurozone sovereign credit risk. Against the yen, the U.S. dollar will likely stay around 100 yen in the near-term as markets focus on Japan's deteriorating economic fundamentals. The dollar will re-test its 2008 highs against other G10 and emerging market currencies but could back down on the expansion of U.S. quantitative easing to government debt. In general, the dollar will benefit in the short-term from U.S. government interventions if they appear to put the U.S. ahead of the curve in fighting recession. By the same token, any scent of increased Treasury borrowing needs on top of already all-time high levels of issuance could turn investors’ noses up at the dollar in the long-term.

The RGE Monitor offers a premium service that contains more detailed information.
Subscribe to All American Investor via Email


Bob DeMarco is a citizen journalist and twenty year Wall Street veteran. Bob has written more than 500 articles with more than 11,000 links to his work on the Internet. Content from All American Investor has been syndicated on Reuters, the Wall Street Journal, Fox News, Pluck, Blog Critics, and a growing list of newspaper websites. Bob is actively seeking syndication and writing assignments.

Follow All American Investor on Twitter


Tuesday, March 10, 2009

S and P 500 Rally Comes as Predicted (Chart)


On Saturday I wrote, S and P Monthly Chart indicates a sharp rally is coming soon. Well it didn't take long. Here is the view of the chart I included.


It was clear that the down slope of the market was too severe and could not be maintained.

I'll be back tonight with some ideas on what I see coming. I will say, an inside day, followed by a "hook" up does look interesting. Is this another two day rally in the big bear market, or something the bulls can really sink their teeth into?
Subscribe to All American Investor via Email


Bob DeMarco is a citizen journalist, blogger, and Caregiver. Bob wrote more than 500 articles with more than 11,000 links to his work on the Internet. His content has been syndicated on Reuters, the Wall Street Journal, Fox News, Pluck, Blog Critics, and a growing list of newspaper websites. Bob is actively seeking syndication and writing assignments.


Monday, March 02, 2009

Is 600 the Bottom in the S and P 500?


Do we have a tech "guru" in the house. How about a Gann expert?

I didn't actually hear this first hand, I read it on the Internet.

A technician at Credit Suisse is forecasting a market bottom for the S and P 500 with a target price of 600-605.

I took a look at the market and I can see where he is getting this. Back in 1995 after breaking above the 600 level for the first time,  the S and P 500 went back and forth against that level for about a year and a half.  Looking at the chart, 650 also looks like a formidable area. We could hit either or both of these areas this week.

I can't find my tech "guru" but 603 also looks like a Fibonacci number and a possible reversal point.

Do we have a tech "guru" in the house? How about a Gann expert?

What do you think?

I picked up this thread on Across the Curve.

clipped from charts.barchart.com
Chart for S&P 500

blog it

Subscribe to All American Investor via Email


Follow us on Twitter

Bob DeMarco is a citizen journalist, blogger, and Caregiver. In addition to being an experienced writer he taught at the University of Georgia , was an Asociate Director and Limited Partner at Bear Stearns, was CEO of IP Group, and is a mentor. Bob currently resides in Delray Beach, FL where he cares for his mother, Dorothy, who suffers from Alzheimer's disease. Bob has written more than 500 articles with more than 11,000 links to his work on the Internet. His content has been syndicated on Reuters, the Wall Street Journal, Fox News, Pluck, BlogCritics, and a growing list of newspaper websites (15). Bob is actively seeking syndication and writing assignments.


More from All American Investor


Merrill goes negative on global GDP growth


Subscribe to All American Investor via Email

Friday, February 27, 2009

Economists question budget's economic assumptions


Does anyone really know?
GDP plays the biggest role in determining the accuracy of deficit forecasts because weaker-than-expected growth swells government payments for such things as unemployment benefits and food stamps and reduces tax receipts.
True.
In its budget, the administration predicted that the overall economy, as measured by the gross domestic product, will shrink by 1.2 percent this year but will grow by a solid 3.2 percent in 2010. That growth would be followed by even stronger increases of 4 percent in 2011, 4.6 percent in 2012 and 4.2 percent in 2013.
Impossible to predict.
By contrast, the consensus of forecasters surveyed by Blue Chip Economic Indicators in February predicted that the GDP will fall by a larger 1.9 percent this year and then increase at weaker rates of 2.1 percent in 2010, 2.9 percent in 2011 and 2012 and 2.8 percent in 2013.
Everybody has an opinion.
"When a country is griped by a financial crisis, the ensuing downturn often lasts much longer than normal," said Sung Won Sohn, an economics professor at the Martin Smith School of Business at California State University. "I think this downturn is gong to last longer and the rebound will be fairly anemic."
Trends tend to persist.
But Mark Zandi, chief economist at Moody's Economy.com, said he believed the extent of the downturn will be more severe than the administration's forecast for this year and that this will prompt even larger policy responses on the part of the government, including increased help for homeowners facing foreclosure and another stimulus from Congress a year from now.
This guy is really smart, I bet even he hopes he is wrong.

Conclusion. Stocks going lower.

Source: Economists question budget's economic assumptions
Subscribe to All American Investor via Email
Follow us on Twitter

Bob DeMarco is a citizen journalist, blogger, and Caregiver. In addition to being an experienced writer he taught at the University of Georgia , managed on Wall Street at Bear Stearns, was CEO of IP Group, and is a mentor. Bob currently resides in Delray Beach, FL where he cares for his mother, Dorothy, who suffers from Alzheimer's disease. Bob has written more than 500 articles with more than 11,000 links to his work on the Internet. His content has been syndicated on Reuters, the Wall Street Journal, Fox News, Pluck, BlogCritics, and a growing list of newspaper websites (15). Bob is actively seeking writing assignments and syndication.


More from All American Investor


Friday, January 30, 2009

Global Economy Grinding to a Halt


The International Monetary Fund (IMF) is now forecasting the global economy to grow at one half of one percent (.5%) in 2009. This is stunning news. Just two months ago the same group was forecasting annual growth at 2.2 percent. Olivier Blanchard, the IMF's chief economist offered these sobering words:
"We expect the global economy to come to a virtual standstill in 2009."
The situation in China continues to deteriorate as growth is forecast an annual rate of 6.7% about half the growth rate they reported in 2007. The forecast of 6.7 percent is suspect due to the way the numbers are calculated in China. One can only wonder if their is a "silent" backlash toward China brewing in the U.S. Helping foster the growing negative attitude in China yesterday Vice President Joe Biden said:
the U.S. would be “blunter with the Chinese” and that China must “play by the rules.”
The U. S. long term bond market reacted by dropping a whopping three points.

In a seperate report the IMF forecast that
financial institutions face much larger losses on U.S. securities than foreseen just weeks ago. Losses now are expected to reach $2.2 trillion, up from the $1.4 trillion estimated last fall.
This can only be regarded as more bad news in the financial sector.

The IMF is predicting that in order to prevent further deterioration in their ability to lend, major U.S. and European banks require an additional $500 billion in new capital, the report said. One can only wonder how these enormous capital needs are going to be met.

This news does not bode well for equities world wide. It is not likely that these continued dire forecasts have been digested into the equity market. And worse, most forecast continue to become more dire with each new release.
Subscribe to All American Investor via Email

Thursday, January 22, 2009

China's economic growth eases sharply


China's economy grew at its slowest pace in seven years in the fourth quarter, as slumping exports put the brakes on the world's fastest-growing major economy.

The Bank of Japan cut its growth forecasts on Thursday, predicting the world's number-two economy would contract for two full years through March 2010.

Underlining the gloom sweeping East Asia's export-driven economies, Sony Corp (6758.T) forecast an operating loss of nearly $3 billion for the 2008/09 business year
Subscribe to All American Investor via Email


China growth slows sharply


By Simon Rabinovitch and Yuzo Saeki

BEIJING/TOKYO (Reuters) - China's economy slowed sharply in the fourth quarter and Japan's central bank said it would slide into two years of deflation as Asia's largest economies buckled under the strain of the global financial crisis.

The Bank of Japan cut its growth forecasts on Thursday, predicting the world's number-two economy would contract for two full years through March 2010, hours after data showed Japanese exports plunged a record amount in December.

Underlining the gloom sweeping East Asia's export-driven economies, Sony Corp forecast an operating loss of nearly $3 billion for the 2008/09 business year and in South Korea Hyundai Motor Co. reported a fall in profit and LG Electronics posted its first net loss in seven quarters.

"With growth in Asia and other emerging economies slowing, there is nothing to support Japanese exports," said Yoshiki Shinke, senior economist at Dai-ichi Life Research Institute.

The global economy has deteriorated relentlessly since a credit crunch that began in 2007 with a U.S. housing slump took a turn for the worse in September with the collapse of Lehman Brothers.

In Washington, President Barack Obama's pick for Treasury Secretary, Timothy Geithner, told senators a detailed plan to rescue the U.S. financial system would be presented in the next few weeks.

Fresh worries that the poor health of banks and economies will require yet greater government intervention have sparked a new wave of risk aversion among investors, driving the Japanese currency toward multi-year highs against the dollar and euro and pushing investors into other safe havens such as U.S. Treasuries.

EXPORTS TUMBLE

Japanese exports in December tumbled an unprecedented 35 percent from a year earlier, while a measure of business sentiment hit a new low.

The figures showed a collapse in demand across the board with record falls in shipments to the United States, Europe and Asia, showing how the global crisis is reaching all corners of the world economy.

The Bank of Japan later said it was holding interest rates just above zero, but announced a string of other steps to try to ease the deepening recession.

The central bank said it would buy corporate bonds to ease an increasingly severe funding squeeze and warned deflation was returning for the second time this decade.

"Japan's economy is worsening sharply and is expected to continue worsening in the near term," the central bank said in a statement.

It saw consumer prices falling 1.1 percent in the year to March 2010 and a 0.4 percent fall the following year.

The yen rallied toward a 13-1/2-year peak against the dollar and a near 7-year high versus the euro hit the previous day.

The British pound resumed its fall against the dollar toward 23-year lows, erasing gains made after a source told Reuters that its slide will be discussed at the next meeting of the Group of Seven industrialized countries.

The pound has been under severe stress this week as a government rescue package for struggling British banks failed to reassure investors or stem losses in banking stocks. Barclays bank slid by a third to a 24-year low.

"Sterling still looks far from hitting a bottom with mounting expectations for further and bigger interest rate cuts from the Bank of England to combat the quickly deteriorating economy," said a senior trader at a Japanese trust bank.

Asia-Pacific stocks fell to a one-month low earlier on Thursday before swinging slightly higher on the day. U.S. Treasuries, a magnet for investors in times of uncertainty, were firmer in Asia trading.

In China, the world's main growth engine in recent years, official data showed that annual economic growth slowed to 6.8 percent in the fourth quarter from 9.0 percent in the third.

That left the pace of expansion for all of 2008 at 9.0 percent, a seven-year low, snapping a five-year streak of double digit growth. Illustrating the extent of the slowdown, China's economy had expanded 13 percent in 2007 to leapfrog Germany as the world's third-biggest economy.

The country's statistics bureau said the financial crisis was spreading and continued to impact the Chinese economy, and that China would aim to stimulate domestic demand.

"The deceleration of growth is beyond the market's consensus, which presents a huge challenge to this year's growth target of 8 percent," said Jin Yanshi, chief economist at Sinolink Securities in Shanghai.

COLLAPSING TRADE

Neighboring South Korea said its economy suffered its second-largest contraction on record in the fourth quarter. That pushes Asia's fourth-largest economy closer to its first recession since the regional financial crisis a decade ago.

Gross domestic product fell a seasonally adjusted 5.6 percent in the last quarter of 2008 from the previous three months, more than twice as much as economists had expected, central bank figures showed.

Trade within East Asia has collapsed as global demand for goods such as cars and electronics shrivels, prompting leading manufacturers such as Toyota Motors to slash production at an unprecedented rate and lay off workers.

Sony, citing the recession, higher yen and restructuring costs, said it was revising it forecast for the year to the end of March to an operating loss of 260 billion yen ($2.9 billion), having previously targeted a profit of 200 billion yen.

Car maker Hyundai said its quarterly earnings fell 28 percent and LG Electronics booked a wider-than-forecast fourth quarter net loss of $490 billion due to big shortfalls at its flat-screen affiliate and weak mobile phone sales.

In another sign of the pain being felt by the tech sector, Intel Corp said it was closing plants in Malaysia and the Philippines, along with its only remaining factory in Silicon Valley, cutting as many as 6,000 jobs.

(Additional reporting by Hideyuki Sano and Sachi Izumi in Tokyo, Zhou Xin in Beijing, Cheon Jong-woo, Yoo Choonsik, Rhee So-eui and Marie-France Han in Seoul, Ritsuko Ando in New York and David Lawder in Washington; Writing by Alex Richardson; Editing by Sonya Hepinstall)

Monday, January 19, 2009

Doom & Gloom in '09


An outlook for 2009, with Nouriel Roubini, Michael Spence, and Philip H. Knight.

Definitely worth your time.


Click here to watch and listen to Doom & Gloom in '09.
Subscribe to All American Investor via Email

Wednesday, January 07, 2009

Wall Street strategists predict 17 percent stock gain in 2009


The average 2009 year-end S&P 500 is 1,056, or 16.9% above the S&P's year-end price of 903.25.
clipped from www.bloomberg.com
Firm                  Strategist                Target  %Change
Barclays Plc Barry Knapp 874 -3.2%
Citigroup Inc. Tobias Levkovich 1,000 11%
Credit Suisse Andrew Garthwaite 1,050 16%
Deutsche Bank Binky Chadha 1,140 26%
Goldman Sachs David Kostin 1,100 22%
HSBC Holdings Kevin Gardiner 1,000 11%
JPMorgan Chase Thomas Lee 1,100 22%
Merrill Lynch Richard Bernstein 975 7.9%
Morgan Stanley Abhijit Chakrabortti 975 7.9%
Strategas Research Jason Trennert 1,100 22%
UBS AG David Bianco 1,300 44%


Strategists See 17% S&P 500 Rise After Saying ‘Buy’ (Update3)
By Lynn Thomasson

Jan. 5 (Bloomberg) -- The same Wall Street strategists who told investors to buy stocks in the worst year since 1937 are even more bullish than a year ago, predicting the Standard & Poor’s 500 Index will rise 17 percent.

UBS AG, JPMorgan Chase & Co. and Deutsche Bank AG say the Federal Reserve’s decision to cut interest rates to as low as zero percent will help revive the U.S. economy and drive investors back to equities. Cheaper fuel prices and more than $850 billion in spending on roads, bridges and health care will send stocks higher, the strategists said.

Even if they’re right, the S&P 500 would end 2009 at 1,056, 28 percent below where the benchmark index for American equities started in 2008 and 35 percent lower than where the analysts said it would be now, based on the consensus of 11 strategists surveyed by Bloomberg News. Some of the biggest investors are growing more optimistic as the S&P 500 advanced 24 percent since reaching an 11-year low on Nov. 20.

“Equities usually find a bottom about halfway through a recession,” said Binky Chadha, the New York-based chief U.S. equity strategist at Deutsche Bank who predicted the S&P 500 would climb 12 percent in 2008 and expects a 26 percent surge this year. “If policy gets it right, we should find a bottom and start to turn around. And if that happens, then it’s time to buy stocks.”

$29 Trillion

Wall Street analysts lost credibility in 2008 when none predicted a down year and the average forecast was for a gain of 11 percent, according to data compiled by Bloomberg. Instead, the S&P 500 tumbled 38 percent to 903.25 and $29 trillion was erased from global markets. The projections for this year would represent the best annual performance since 2003, when the S&P 500 climbed 26 percent.

U.S. stocks fell for the first time in four days as concern that a slump in corporate profits will stretch into 2009 overshadowed speculation the government will revive the economy with tax cuts. The S&P 500 slipped 0.5 percent to 927.45 today, halting its longest stretch of gains since November.

Concern that stock losses will deepen remains elevated even after falling from record levels in October and November.

The Chicago Board Options Exchange Volatility Index, which measures price swings, ended 2008 at 40, up 78 percent from a year ago and more than triple the level at the start of 2007.

TED Spread

The Libor-OIS spread, a measure of cash scarcity, closed 2008 at 121 basis points after averaging about nine basis points in the year before credit markets started freezing up in August 2007. The difference between what the U.S. government and banks pay to borrow for three months, the so-called TED Spread, is about three times higher than before the credit crisis started, according to data compiled by Bloomberg.

Treasuries returned 14 percent last year, the most since 1995, according to Merrill Lynch & Co. indexes. Investors sought the relative safety of government debt as losses and writedowns at the world’s biggest financial companies rose toward $1 trillion and the economies of the U.S., Europe and Japan fell into the first simultaneous recessions since World War II.

“People have been telling the investing public for the past six months to stay the course or buy this great opportunity, and it’s turned out to be a liability,” said Randy Bateman, who oversees $15 billion as chief investment officer of the asset management unit of Huntington Bancshares Inc. in Columbus, Ohio. “Any outlook right now is subject to a great deal of skepticism.”

‘All Available Tools’

Stocks rallied at the end of the year as the Fed said it will “employ all available tools” to revive the economy and President-elect Barack Obama pledged to boost growth through the biggest infrastructure investment since the 1950s.

The combination of government stimulus and oil’s 69 percent drop from its July record of $147.27 a barrel may pop the “bubble of pessimism” toward stocks, according to David Bianco of UBS, Wall Street’s biggest bull.

“The consensus outlook for 2009 is a full year of gloom,” Bianco, 33, wrote in his annual market outlook last month. “We believe 2009 will bring signs of a dawn in confidence with the first faint light appearing earlier than most investors expect.”

The S&P 500 began recovering an average five months before recessions ended in 1975, 1982, and 1991, data compiled by Bloomberg show.

‘Greatest Roars’

Bianco predicted 12 months ago that the S&P 500 would climb 16 percent in 2008, and stayed bullish after the subprime mortgage meltdown spurred the collapse of Bear Stearns Cos., then the fifth-largest U.S. securities firm, in March. He said in a July interview with Bloomberg News that the rebound in stocks during the second half of 2008 would be the “one of the greatest roars we’ve seen.”

UBS’s New York-based equity strategist now expects the S&P 500 to reach 1,300 this year as share prices cheap relative to earnings become irresistible. Last year’s slump left S&P 500 companies valued at an average 12.9 times operating profit, near the lowest since at least 1998, monthly data compiled by Bloomberg show.

The S&P 500’s dividend yield may be the “most compelling” signal that stocks are inexpensive, Abhijit Chakrabortti, Morgan Stanley’s New York-based head of global equity strategy, wrote Nov. 25. He expects the index to advance 7.9 percent this year.

The dividend payout for companies in the index climbed above the yield on the 10-year U.S. Treasury note for the first time in 50 years in November and is now 3 percent. That’s 0.67 percentage point more than the yield on 10-year notes, data compiled by Bloomberg show.

‘Staging a Recovery’

JPMorgan’s Thomas Lee says the 47 percent drop in gasoline prices last year to an average $1.62 a gallon, according to AAA, combined with Obama’s plan for stimulating growth may revive consumer spending in the second half of 2009. Retailers are among the New York-based bank’s “top picks” for 2009. The S&P 500 Retailing Index trades at 12.5 times the earnings of its 27 companies, about half the average ratio this decade.

“Every year’s a new year,” said Lee, 39, who expects the S&P 500 to rise to 1,100. “One of the big hurdles is obviously going to be coaxing investors back. As we exit ‘09 we think the economy is staging a recovery,” he said in a telephone interview.

Economic Data

Economic statistics give little indication that a recovery is imminent. Consumer confidence sank in December to the lowest since records began in 1967, raising the risk that spending will weaken in 2009, data from the New York-based Conference Board showed last week.

Gross domestic product will contract in the first half of this year, while household spending is expected to fall 1 percent in 2009, the biggest drop since the aftermath of the attack on Pearl Harbor, according to Bloomberg surveys of economists.

Corporate profits have fallen for seven quarters, according to the U.S. Bureau of Economic Analysis. Should earnings drop through the first half of 2009, as analysts surveyed by Bloomberg project, it will be the longest stretch of decreases since the government started tracking quarterly data in 1947.

The decline in corporate profits will probably push the S&P 500 back to its 11-year low of 752.44, according to Barclays Plc’s Barry Knapp, the only forecaster calling for the index to drop. He says the index will fall 3.2 percent.

‘Little Bit Early’

“We do think there will be an economic recovery in the back half of the year,” Barclays’ New York-based chief U.S. equity strategist said in a telephone interview. “You can do OK with the equity market this year, it’s just a question of when you commit. Right now, it’s a little bit early.”

The biggest bears at the start of last year, Morgan Stanley’s Chakrabortti and Merrill Lynch & Co.’s Richard Bernstein, had called for the S&P 500 to climb 3.9 percent to 1,525.

The index ended the year 41 percent below their estimate, data compiled by Bloomberg show. More than half of the S&P 500’s decline for 2008 came after Lehman Brothers Holdings Inc., once the fourth-largest U.S. securities firm, filed the biggest bankruptcy in history on Sept. 15.

“The thing we all got wrong was that there would be a safety net to catch any and all large financial institutions,” Deutsche Bank’s Chadha said. “Letting Lehman go has had devastating effects.”

Merrill’s Bernstein forecasts a bigger advance for the S&P 500 this year than his 2008 prediction, saying the index will climb 7.9 percent to 975. With global growth likely to “negatively surprise,” the New York-based strategist recommended utilities and makers of household products and drugs in a Dec. 9 note.

‘Textbook and History’

The MSCI World Consumer Staples Index, which includes makers of food, beverages and consumer goods, is valued at 15.2 times earnings, the cheapest since at least 1995, monthly data compiled by Bloomberg show. The MSCI World Health-Care Index ended 2008 valued at 16 times profit after trading at a ratio of 15.1 in November, the cheapest in at least 13 years.

The MSCI World Utilities Index ended 2008 with a dividend yield of 4.4 percent, about twice that of 10-year Treasuries. The ratio was the highest since at least 1995, monthly Bloomberg data show.

“Looking at the textbook and history of the market, it looks like there’s potential for a rally,” said John Carey, the Boston-based investor who runs the $4.64 billion Pioneer Fund that beat 74 percent of its peers last year. “It would be risky to be out of the market right now.”


To contact the reporter on this story: Lynn Thomasson in New York at lthomasson@bloomberg.net.