Showing posts with label s and p 500. Show all posts

Thursday, April 23, 2009

Stock Market Uptrend Still In Tact (Chart)


S andf P 500 Chart 423

As evidenced by the chart, the uptrend in the S and p 500 is continuing.

This weeks test of the green line shows that support under the market is continuing to build.

One area of concern is the six straight up weeks in the market. Statistically this is unusual and rarely seen -- even in bull markets.

It will be interesting to see if the market can make it seven in a row this week.

There is serious overhead resistance right at and above current levels. It appears the market needs a catalyst to move out of this congestion.

A close about 875 is needed to bring the momentum back into the market.

We are waiting for the red line to turn up before turning on the bullish enthusiasm.
Subscribe to All American Investor via Email


Bob DeMarco is a citizen journalist and twenty year Wall Street veteran. Bob has written more than 500 articles with more than 11,000 links to his work on the Internet. Content from All American Investor has been syndicated on Reuters, the Wall Street Journal, Fox News, Pluck, Blog Critics, and a growing list of newspaper websites. Bob is actively seeking syndication and writing assignments.


More from All American Investor


Follow All American Investor on Twitter

Monday, April 13, 2009

S and P 500 Update Chart


June S and P 500 Future, Chart, April 13, Pre Opening

June S and P 500 Chart 413

Notes:
  • Once again we bounced off the red line (plus two standard deviations) on Friday.
  • The market continues to attach to the red line during the rally.
  • The market continues to make higher highs and higher lows. A positive.
  • The uptrend remains intact. The lines continue to rise and are containing the market.
  • Retracements can come at any time.
  • Expect hard resistance on any rallies toward 860 today.
  • Support is rising, but still down to 800.
Subscribe to All American Investor via Email


Bob DeMarco is a citizen journalist and twenty year Wall Street veteran. Bob has written more than 500 articles with more than 11,000 links to his work on the Internet. Content from All American Investor has been syndicated on Reuters, the Wall Street Journal, Fox News, Pluck, Blog Critics, and a growing list of newspaper websites. Bob is actively seeking syndication and writing assignments.


More from All American Investor


Follow All American Investor on Twitter

Monday, March 23, 2009

S and P 500 Trying to Turn Up (Chart)


Subscribe to All American Investor via Email

June SP Future 323

From a short term technical perspective the June S and P futures contract is trying to turn up. It is easy to see that there is substantial technical resistance around the 800 level. We should see several test of this level this week.

The market is acting in anticipation of the re-inflation of toxic assets via the "new Geithner plan". This news should be respected as it is likely to create an overall bullish tone.

It should be obvious that asset buying by the Treasury and low interest rates are likely to have a very bullish effect. The big question is how much and for how long?

The market is certainly showing some technical resiliency for the first time in several months. We will be watching the slope of the 40 day average closely. More on this later in the week.

Friday, March 06, 2009

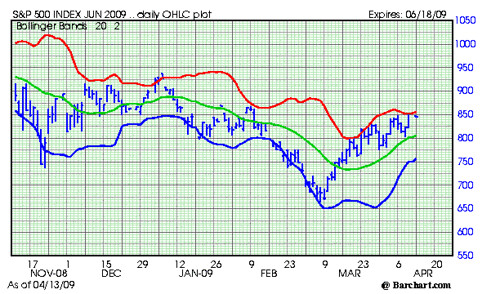
S an P Support 659 and dropping, Market Capitulation


Could we be on the edge of a market capitulation?

The S and P 500 continues to trend down with support for today in the 659 area. 659 is about 3.7 percent lower than the current S and P price as I am writing this.

A market capitulation occurs when investors surrender all hope of recouping their losses in the market--and sell in a panic.

It appears to me that we could be reaching the capitulation point. The market bears close watching today. A close around or below the 659 area would not bode well for the opening on Monday morning. On the other hand, a market capitulation is one of the few times where you can make real money in the market quickly.
clipped from charts.barchart.com
Chart for S&P 500
blog it

Monday, March 02, 2009

Is 600 the Bottom in the S and P 500?


Do we have a tech "guru" in the house. How about a Gann expert?

I didn't actually hear this first hand, I read it on the Internet.

A technician at Credit Suisse is forecasting a market bottom for the S and P 500 with a target price of 600-605.

I took a look at the market and I can see where he is getting this. Back in 1995 after breaking above the 600 level for the first time,  the S and P 500 went back and forth against that level for about a year and a half.  Looking at the chart, 650 also looks like a formidable area. We could hit either or both of these areas this week.

I can't find my tech "guru" but 603 also looks like a Fibonacci number and a possible reversal point.

Do we have a tech "guru" in the house? How about a Gann expert?

What do you think?

I picked up this thread on Across the Curve.

clipped from charts.barchart.com
Chart for S&P 500

blog it

Subscribe to All American Investor via Email


Follow us on Twitter

Bob DeMarco is a citizen journalist, blogger, and Caregiver. In addition to being an experienced writer he taught at the University of Georgia , was an Asociate Director and Limited Partner at Bear Stearns, was CEO of IP Group, and is a mentor. Bob currently resides in Delray Beach, FL where he cares for his mother, Dorothy, who suffers from Alzheimer's disease. Bob has written more than 500 articles with more than 11,000 links to his work on the Internet. His content has been syndicated on Reuters, the Wall Street Journal, Fox News, Pluck, BlogCritics, and a growing list of newspaper websites (15). Bob is actively seeking syndication and writing assignments.


More from All American Investor