Showing posts with label s and p. Show all posts

Monday, August 23, 2010

S and P Chart 823


The S&P made a lower high last week giving us a point against which to plot a short term down trend (purple line). That marks 1097 as resistance and 1009/1042 as support.
By Steve Cook
All American Investor

I still want prices in the lower quadrant of the current trading range (1009-1044) before committing funds.

Note that holding 1042 would meet that criterion.


Also note that historically stocks perform their worst in September which is clearly upon us. So I am in no hurry to rush to stocks.

Wednesday, May 13, 2009

Retail Sales a Picture Worth a Thousand Words--UGH (Chart)


Retail sales dropped .4 percent for the month and are down 10.1 percent year over year. Retail sales account for two thirds of GDP. This report is bearish on the market.

There is a strong relationship between GDP and stocks. This report really puts pressure on relative valuations. The risk of owning stocks is mounting as we pointed out last week in our article --They called me crazy, S and P 900-1000 (Part Two)
  • A major retracement to the downside is likely, and is imminent.
  • The bottom line. The risks out weigh the rewards at this level.
The S and P was trading near 925 when we wrote that. Now down 4 percent.

We will update the S and P numbers shortly.


Subscribe to All American Investor via Email
Bob DeMarco is a citizen journalist and twenty year Wall Street veteran. Bob has written more than 500 articles with more than 11,000 links to his work on the Internet. Content from All American Investor has been syndicated on Reuters, the Wall Street Journal, Fox News, Pluck, Blog Critics, and a growing list of newspaper websites. Bob is actively seeking syndication and writing assignments.


Follow All American Investor on Twitter

Wednesday, May 06, 2009

They called me crazy, S and P 900-1000 (Part Two)


When I wrote Stocks Don't Fight the Tape the S and P 500 was around 768. I predicted a rally into the 900-1000 area.

I followed that up with They called me crazy, S and P 900-1000

What next?
S and P 500 Chart 507
  • The stock market is currently overbought.
  • The technical correction in the current bear market is two months old.
  • A major retracement to the downside is likely, and is imminent.
  • We could see additional upside to the 940 area versus the S and P 500.
  • A test of the 840 area is likely.
  • Once the correction gets underway we should get a better understanding of the structure of the market. Begining of long term bull, or bear market still in tact?
  • The important 200 day average is still about 100 points above the market and the down ward slope of that average is becoming more severe. This is not a good sign.
The bottom line. The risks out weigh the rewards at this level.

This has been a tremendous rally that I expected. However, in terms of price and duration it fits the requirements for a correction in a market that is still trending down.

In addition, the longer dated treasury interest rates are turning up. This is a negative. The dollar looks very vulnerable right now. Another negative. The combination of rising rates in the long end and a dropping dollar does not bode well for stocks.
Subscribe to All American Investor via Email
Bob DeMarco is a citizen journalist and twenty year Wall Street veteran. Bob has written more than 500 articles with more than 11,000 links to his work on the Internet. Content from All American Investor has been syndicated on Reuters, the Wall Street Journal, Fox News, Pluck, Blog Critics, and a growing list of newspaper websites. Bob is actively seeking syndication and writing assignments.


Follow All American Investor on Twitter

Thursday, April 09, 2009

Stocks the Nervous Norvis Market (Chart and View)


There are a lot of Nervous Norvises out there.

When the market moves down for a couple of days your typical Nervous Norvis bull gets sweaty palms and heart palpitations. A couple of days down and the bears are pounding their chest. The only thing the bears can think about is bad news. Left to wonder of course, why is the market going up with all this bad news--the world is coming to an end.

Stocks the Nervous Norvis Market

The Stock market is in a classic uptrend from the capitulation low.

Review:
At the moment:
  • The market continues to make higher lows. The most important ingredient of a trend.
  • The market found support on a dip three times. This indicates there are buyers below the market. This is necessary to raise confidence.
  • Bears continue to try and sell the market. The big difference they are running for cover at the first sign of strength.
  • The slope of the green line (midpoint, support) continues to point up and is strengthening.
  • The blue line is picking up momentum and as long as this continues it will help propel the market higher,
  • The market is once again approaching the red line (two standard deviations up) and this should be watched. Short term traders should resist the urge to buy the market when it is at, near, or above the red line. This is where nervous norvises really get killed.
  • There is still substantial resistance from 850-875. This is where the market will likely wear out bulls who lack patience. They will get out and will likely start chasing it right into the top and before the next major test of the downside.
Subscribe to All American Investor via Email


Bob DeMarco is a citizen journalist and twenty year Wall Street veteran. Bob has written more than 500 articles with more than 11,000 links to his work on the Internet. Content from All American Investor has been syndicated on Reuters, the Wall Street Journal, Fox News, Pluck, Blog Critics, and a growing list of newspaper websites. Bob is actively seeking syndication and writing assignments.


More from All American Investor


Follow All American Investor on Twitter

Sunday, April 05, 2009

S & P 500 Up 24.53 Percent in 20 Days (Chart)


S and P 500 Chart
  • The S and P 500 has risen 24.53 percent in the last 20 trading days (close only).
  • The S and P closed at 842.50 on Friday.
  • There is substantial overhead resistance beginning at 850, all the way up to 875.
  • Resistance, as measured by the red line (two standard deviations, up) is around the 865 area and is flattening but still moving up.
  • Hard support is now well below the market around the 780 area. The slope of the green line (mid point of the range) continues to slope up. This is a positive.

S and P 500 Daily Chart 405
Subscribe to All American Investor via Email


Bob DeMarco is a citizen journalist and twenty year Wall Street veteran. Bob has written more than 500 articles with more than 11,000 links to his work on the Internet. Content from All American Investor has been syndicated on Reuters, the Wall Street Journal, Fox News, Pluck, Blog Critics, and a growing list of newspaper websites. Bob is actively seeking syndication and writing assignments.

Follow All American Investor on Twitter

More from All American Investor


Thursday, April 02, 2009

S & P 500 Trend Up, Resistance, Chart


June S and P Future, Chart

JUNE SP 4021

Notes:
  • The market held the down thrust below 790. The reversal indicates the uptrend is intact.
  • Yesterday's outside, up day, with a close at the high indicated that a test of the resistance in the 830 area was likely.
  • The ability of the market to hold above the green line is important and impressive.
  • Short term support is at 770 and rising.
  • Near term resistance is in the 830 area. Overhead resistance is at 857 and rising.
  • Trades and or a close above 832 will test the will of the shorts.
  • The market continues to trade up against bad news. Shorts continue to pile into the market believing that the market should be going down against this evidence.
  • All I can say to shorts is---Don't Fight the Tape.
  • Technical evidence continues to indicate higher prices.
See: 

They called me crazy, S and P 900-1000


Bob DeMarco is a citizen journalist and twenty year Wall Street veteran. Bob has written more than 500 articles with more than 11,000 links to his work on the Internet. Content from All American Investor has been syndicated on Reuters, the Wall Street Journal, Fox News, Pluck, Blog Critics, and a growing list of newspaper websites. Bob is actively seeking syndication and writing assignments.


Follow All American Investor on Twitter
Subscribe to All American Investor via Email

Wednesday, April 01, 2009

S & P 500 Stress Test for the Bears


S and P 500, Chart, Daily, Midday.

S & P 500 Stress Test

Highlights:
  • It is early in the day but the market made a new low, below yesterday's low, reversed, and is now clawing its way back over 800. A positive short term development.
  • The chart gap is still in play. The S & P needs to trade to 813.43 to fill the gap. This area should be watched closely.
  • Trading is slow so far. However, it the market closes above that gap the bears will be forced to run for cover.
  • A close above yesterday's high of 810.48 would give us an outside up day. That would be very bullish. It would also give us another hook up in the chart.
  • We need to watch closely to be sure support is building below the market. A pattern of higher highs and higher lows is what we are looking for to remain bullish.
In spite of all the bear chatter and shorting in the market, the S and P is only 30 points from the high for this move--made last week. A move above yesterday's high will put extreme pressure on the bears.

Looks like a bear stress test to me so far.
Subscribe to All American Investor via Email

Bob DeMarco is a citizen journalist and twenty year Wall Street veteran. Bob has written more than 500 articles with more than 11,000 links to his work on the Internet. Content from All American Investor has been syndicated on Reuters, the Wall Street Journal, Fox News, Pluck, Blog Critics, and a growing list of newspaper websites. Bob is actively seeking syndication and writing assignments.


More from All American Investor


Tuesday, March 31, 2009

S & P Case Shiller Home Price Indices Chart


Data through January 2009, released today by Standard & Poor’s for its S&P/Case-Shiller1 Home Price Indices, the leading measure of U.S. home prices, shows continued broad based declines in the prices of existing single family homes across the United States, with 13 of the 20 metro areas showing record rates of annual decline, and 14 reporting declines in excess of 10% versus January 2008.


SP Case Shiller Home Price Indices Chart


Follow All American Investor on Twitter
Subscribe to All American Investor via Email

Source: S&P/Case-Shiller Home Price Indices

Monday, March 30, 2009

S & P 500 Correction or Rejection?


S & P 500 Chart, Daily Bar, March 30

S & P 500, Chart 3302
What to watch:
  • Half way back price is 833. This is an important technical retracement point.
  • The green line (the midpoint) is 756 and rising. Tomorrow it should be around the 764 area. The market should find good support at the line.
  • The first major support area is 740-752. From previous up and down moves.
  • The small gap from the opening is troublesome, and needs to be closed.
The S & P 500 is at a major turning point. I wrote earlier about the importance of establishing support below the market. This test of support is happening now. If the uptrend is good, this support will hold and the market will return to the upside resistance in the 825 area. If the market falls below 740 a test of the lows would be indicated.

It is always easier to be bullish once the market starts to establish support. This lets you know that there are willing buyers on in waiting.

I still favor the upside. But, it really is a coin toss right now.

Subscribe to All American Investor via Email

Bob DeMarco is a citizen journalist and twenty year Wall Street veteran. Bob has written more than 500 articles with more than 11,000 links to his work on the Internet. Content from All American Investor has been syndicated on Reuters, the Wall Street Journal, Fox News, Pluck, Blog Critics, and a growing list of newspaper websites. Bob is actively seeking syndication and writing assignments.

Follow All American Investor on Twitter

More from All American Investor


Thursday, March 26, 2009

S and P 500 Looks good as forecast be careful now (Chart)


S and P 500 March 26 Close
S and P 500 Chart 3262


On March 7, we showed the Monthly Chart of the S and P 500 and wrote,
You can see the slope of the market is very severe. This cannot be sustained much longer. When a market index trades down at a sharp angle like the one above, the market always rallies sharply when it reverses directions. This rally could start at any time.
The Market closed at 676.53 on March 6, and the big rally started the next day. On March 22 we wrote, Stocks Don't Fight the Tape, and the market blasted off the next day.

The market looks very good and continues to hug the red line on the way up (two standard deviations above the line). However, any sharp rally tomorrow will be met with stiff resistance. We will update the numbers in the morning.

Also, a note of cautions. The slope of the uptrend is getting too severe and the market will be subject to a sharp correction if this continues.

Subscribe to All American Investor via Email


Bob DeMarco is a citizen journalist and twenty year Wall Street veteran. Bob has written more than 500 articles with more than 11,000 links to his work on the Internet. Content from All American Investor has been syndicated on Reuters, the Wall Street Journal, Fox News, Pluck, Blog Critics, and a growing list of newspaper websites. Bob is actively seeking syndication and writing assignments.

Follow All American Investor on Twitter
More from All American Investor


S and P Chart Healthy and Congested


S and P 500 Cash, Chart, March 26.

S an P 500 Chart 326


This S and P chart continues to show that technical resilience is building. The S and P is still in a range expansion and this indicates that volatility could pick up at any time. The red line (plus two standard deviations) is sloping up and the market is continuing to hug the line. All short term positives.

The other day we mentioned that there was considerable resistance and congestion in the 825 area. The market continues trying to attack this area. There is more upside potential on a short term basis then we had a few days ago, now up to the 850 area. Good support is down around 750 and is rising.

Bulls should be a bit cautious right now. If the market can't get firmly through 825 soon, the market might be ripe for a further test of the downside to establish support.

Short term still looks good to me.


Subscribe to All American Investor via Email


Bob DeMarco is a citizen journalist and twenty year Wall Street veteran. Bob has written more than 500 articles with more than 11,000 links to his work on the Internet. Content from All American Investor has been syndicated on Reuters, the Wall Street Journal, Fox News, Pluck, Blog Critics, and a growing list of newspaper websites. Bob is actively seeking syndication and writing assignments.

Follow All American Investor on Twitter
More from All American Investor


Wednesday, March 25, 2009

They called me crazy, S and P 900-1000


On Sunday, I wrote an article on this blog entitled, Stocks Don't Fight the Tape.

In the article I wrote the following,
My guess is that we are going to have one monster rally shortly. I could envision the market on the S and P 500 soaring up to 900 or 1000. That would qualify as one heck of a rally.
When I wrote that article the S and P 500 was at 768.54.

On the open yesterday, I pointed out that the S and P 500 chart indicated the market was overbought. The S and P was hitting its red line (two standard deviations above the mean). The statistical odds always favor a pullback when that happens. The other point I was making, was that, the market now has some good technical resilience. This is a necessary component before a market can get into a healthy uptrend.

Just so you won't think I am some kind of all the time bulldog, you can go read an article I wrote on this blog when I was nutsy bearish back in September--Financial Meltdown--Where there is Smoke, there is Fire. I concluded that article by saying, "cash was king". At the time, the S and P 500 was well above 1200.

This investment blog is relatively new. I am seeking more subscribers (free). If you think this is worthwhile please subscribe. And then, tell your friends. Thanks.

The purpose here is to keep you thinking and help you make good decisions. On occasion you will find some gems like, Don't Fight the Tape.
Subscribe to All American Investor via Email
Bob DeMarco is a citizen journalist and twenty year Wall Street veteran. Bob has written more than 500 articles with more than 11,000 links to his work on the Internet. Content from All American Investor has been syndicated on Reuters, the Wall Street Journal, Fox News, Pluck, Blog Critics, and a growing list of newspaper websites. Bob is actively seeking syndication and writing assignments.

Tuesday, March 24, 2009

S and P 500 Attacking the Red LIne (Chart)


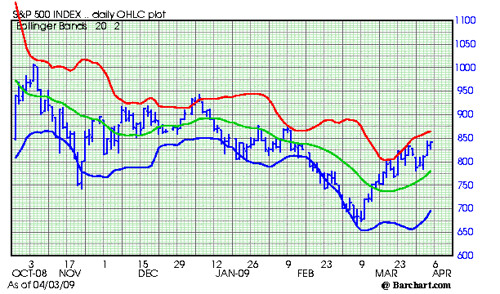
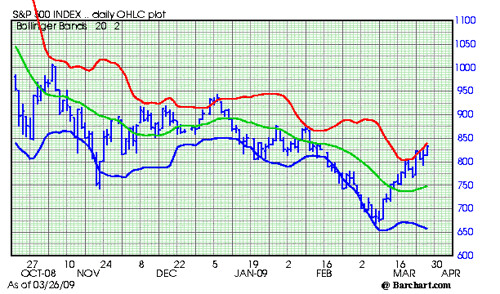
The rally in the S and P 500 the last two weeks has been nothing short of spectacular.

S and P 500 Chart 324


If you take a good look at the chart you will notice that the S and P bounced off the red line on March 18, 19. The red line should be considered resistance, and trades over that line are often met with resistance. The red line is the two standard deviation barrier.

Once again, we are bouncing off the line. So today looks like a day of rest. The red line is now sloping up fast, and short term we are in a range expansion. The market will have additional upside potential in the days ahead. However, if you look across the chart, all the way back to October, you will notice there is a lot of congestion in the 825 area.

Sooner or later, the market will back up and test some lower resistance. This is when the market will prove itself or fail. I understand that people are anxious to get their money back. However, since the bottom occurred, the market has not had a correction or any serious test of prices on the down side.

To become a comfortable bull, it is necessary to see the market probe lower levels and hold. Once good support areas can be identified, it is much easier for traders to add support to the market by buying againsst those support levels.

It is too early to tell if this is a correction in a bear market, or the turn in the market. The market still needs to prove on drops that there are buyers in waiting.

It is a good time to be patient. The market does look good on a short term basis right now.
Subscribe to All American Investor via Email


Bob DeMarco is a citizen journalist and twenty year Wall Street veteran. Bob has written more than 500 articles with more than 11,000 links to his work on the Internet. Content from All American Investor has been syndicated on Reuters, the Wall Street Journal, Fox News, Pluck, Blog Critics, and a growing list of newspaper websites. Bob is actively seeking syndication and writing assignments.


Follow All American Investor on Twitter

Sunday, March 22, 2009

S and P 500 Weekly Chart


S an P 500 Weekly Chart March


On March 7, we posted the Monthly chart of the S and P 500 and pointed out the slope of the market was unsustainable and that a rally was likely. From that article,
You can see the slope of the market is very severe. This cannot be sustained much longer. When a market index trades down at a sharp angle like the one above (See March 7 chart), the market always rallies sharply when it reverses directions. This rally could start at any time.
Since then, we had two weeks up in the market as shown in the weekly chart above.

Now the question is what next? Technically this is a difficult question to answer. I would say this week is fifty-fifty. As you can see, the downtrend is still intact. The market is now above the blue line which indicates the severe oversold condition is not over. Overall, it is always more risky to be a buyer when the trend of the market is down--so it is still a time to be very cautious. I would also so, at this point the easy money has already been made on the downside. Toss up.

My best guess right now is that market is going to continue to consolidate and move sideways in the area between 663 and 800 before it makes its next move. On the fundamental side, I will be posting a new article entitled, Don't Fight the Tape, which makes an argument for additional upside in the market.
Subscribe to All American Investor via Email
Bob DeMarco is a citizen journalist and twenty year Wall Street veteran. Bob has written more than 500 articles with more than 11,000 links to his work on the Internet. Content from All American Investor has been syndicated on Reuters, the Wall Street Journal, Fox News, Pluck, Blog Critics, and a growing list of newspaper websites. Bob is actively seeking syndication and writing assignments.


Tuesday, March 17, 2009

S and P 500 Current Bear Market (Chart) March 17


The slope of the green line continues to point downward leaving the market vulnerable to the downside. The blue and red lines continues to close indicating a consolidation is in place.

The short term trend is flat. The intermediate and longer term trends are still down at this time. As is obvious, the resistance is up near 800, and support is down near 666. The market should find near term resistance at 775-780, and near term support at 725-730.

Use this link for a larger, more flexible version of the chart.

June S and P Future March 17


Follow All American Investor on Twitter

Saturday, March 14, 2009

S and P 500 Current Bear Market (Chart)


This is a fabulous chart from dshort.com. The chart shows all the drops and rallies dating back to the S and P 500 market top on October 9, 2007 at 1565.15 (closing prices). Click on the chart for the bigger--dshort view.
Subscribe to All American Investor via Email

Bob DeMarco is a citizen journalist and twenty year Wall Street veteran. Bob has written more than 500 articles with more than 11,000 links to his work on the Internet. Content from All American Investor has been syndicated on Reuters, the Wall Street Journal, Fox News, Pluck, Blog Critics, and a growing list of newspaper websites. Bob is actively seeking syndication and writing assignments.

Follow All American Investor on Twitter
More from All American Investor


Wednesday, March 11, 2009

S and P 500 usually a good sale after two days UP in downtrend


It is not unusual for the a severely down sloped market to see a sharp two day contra trend rally. We are seeing that right now in the S and P 500.

Savvy short term traders should look to sell any rally into the 740-750 range on Wednesday night or Thursday. It is always a good idea to sell after two days up in a downtrend. Remember to limit your risk.

The inside day after the bottom, followed by a hook up does warrant some caution. It is possible that we could see an extension of the rally after a short pop down. The more significant resistance in this down trend is up above 800 right now.

The down trend remains intact. Those selling rallies in this monster downtrend that started in September have done very well. However, the downtrend has been in force for several months, and has come a long way. As the S and P 500 extends to the downside, selling the market becomes more risky. The easy money has been made on the short side time for the time being. Johnny come lately traders should keep this in mind. Savvy traders should be taking less risk in their trades at this point. This is not the time to get greedy or to get carried away with the madness of the crowd.


Subscribe to All American Investor via Email

Bob DeMarco is a citizen journalist and twenty year Wall Street veteran. Bob has written more than 500 articles with more than 11,000 links to his work on the Internet. Content from All American Investor has been syndicated on Reuters, the Wall Street Journal, Fox News, Pluck, Blog Critics, and a growing list of newspaper websites. Bob is actively seeking syndication and writing assignments.