On March 7, we showed the Monthly Chart of the S and P 500 and wrote,
You can see the slope of the market is very severe. This cannot be sustained much longer. When a market index trades down at a sharp angle like the one above, the market always rallies sharply when it reverses directions. This rally could start at any time.The Market closed at 676.53 on March 6, and the big rally started the next day. On March 22 we wrote, Stocks Don't Fight the Tape, and the market blasted off the next day.
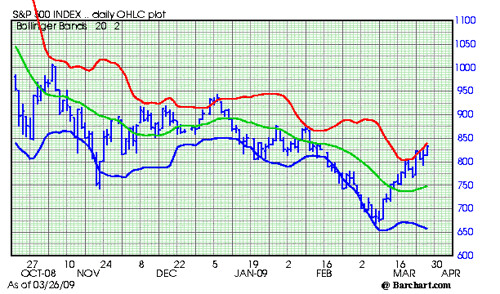
The market looks very good and continues to hug the red line on the way up (two standard deviations above the line). However, any sharp rally tomorrow will be met with stiff resistance. We will update the numbers in the morning.
Also, a note of cautions. The slope of the uptrend is getting too severe and the market will be subject to a sharp correction if this continues.
Subscribe to All American Investor via Email
 Bob DeMarco is a citizen journalist and twenty year Wall Street veteran. Bob has written more than 500 articles with more than 11,000 links to his work on the Internet. Content from All American Investor has been syndicated on Reuters, the Wall Street Journal, Fox News, Pluck, Blog Critics, and a growing list of newspaper websites. Bob is actively seeking syndication and writing assignments. Bob DeMarco is a citizen journalist and twenty year Wall Street veteran. Bob has written more than 500 articles with more than 11,000 links to his work on the Internet. Content from All American Investor has been syndicated on Reuters, the Wall Street Journal, Fox News, Pluck, Blog Critics, and a growing list of newspaper websites. Bob is actively seeking syndication and writing assignments. |
Follow All American Investor on Twitter
More from All American Investor
No comments:
Post a Comment