- The S and P 500 has risen 24.53 percent in the last 20 trading days (close only).
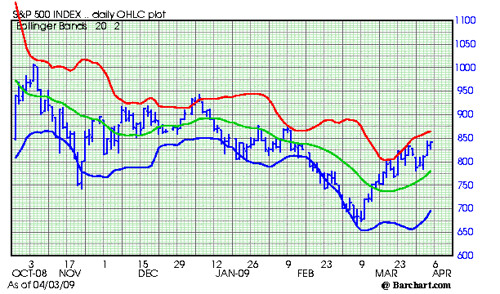
- The S and P closed at 842.50 on Friday.
- There is substantial overhead resistance beginning at 850, all the way up to 875.
- Resistance, as measured by the red line (two standard deviations, up) is around the 865 area and is flattening but still moving up.
- Hard support is now well below the market around the 780 area. The slope of the green line (mid point of the range) continues to slope up. This is a positive.
Subscribe to All American Investor via Email
 Bob DeMarco is a citizen journalist and twenty year Wall Street veteran. Bob has written more than 500 articles with more than 11,000 links to his work on the Internet. Content from All American Investor has been syndicated on Reuters, the Wall Street Journal, Fox News, Pluck, Blog Critics, and a growing list of newspaper websites. Bob is actively seeking syndication and writing assignments. Bob DeMarco is a citizen journalist and twenty year Wall Street veteran. Bob has written more than 500 articles with more than 11,000 links to his work on the Internet. Content from All American Investor has been syndicated on Reuters, the Wall Street Journal, Fox News, Pluck, Blog Critics, and a growing list of newspaper websites. Bob is actively seeking syndication and writing assignments. |
Follow All American Investor on Twitter
More from All American Investor
- 30 Year Conventional Mortgage Rate (Chart)
- Top Hedge Fund Managers Make Billions in 2008
- Systemic Risk Defined--Too Big to Fail
- Ray Dalio on the current state of affairs in the market
- Roubini Predicts U.S. Losses May Reach $3.6 Trillion
- Option ARM--The Toxic Mortgage
- Warren Buffett's Annual Letter to Investors (Cliff Notes Version)
No comments:
Post a Comment