Notes:
- Gold has a tendency to be weak on a seasonal basis at this time of year. Right now, both industrial and jewelry demand are weak. This pattern usually persists until summer.
- Demand for gold is slow due to the weakness in the global economy.
- Seasonal demand patterns in gold are sometimes offset by investor demand for physical gold and ETFs. This is happening right now.
- Central banks continue to be large net sellers of Gold. Central banks have been net sellers of gold sales since 1999. Obviously, investor demand has been offsetting these large sales.
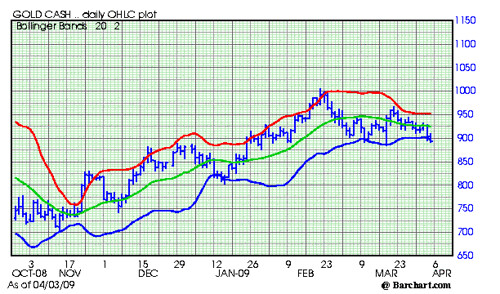
- The above chart indicates that Gold is vulnerable to additional downside.
- The market continues to trade back to the area right below 900. This is an indication that the Gold market wants to test lower levels.
- If Gold holds these levels and trades above 1,000, an important new bull market would be starting.
- Gold is likely to trade down an test the 865-875 area near term.
- Longer term gold is likely to move higher and test the all time highs. Current odds, patterns, and seasonal factors favor this to occur in the second half of the year.
- I am reminded of the saying--it is the job of the market to wear you out. Current trading in gold is causing lots of "angst" and the weak longs are likely to "puke" it up before we go higher.
Subscribe to All American Investor via Email
 Bob DeMarco is a citizen journalist and twenty year Wall Street veteran. Bob has written more than 500 articles with more than 11,000 links to his work on the Internet. Content from All American Investor has been syndicated on Reuters, the Wall Street Journal, Fox News, Pluck, Blog Critics, and a growing list of newspaper websites. Bob is actively seeking syndication and writing assignments. Bob DeMarco is a citizen journalist and twenty year Wall Street veteran. Bob has written more than 500 articles with more than 11,000 links to his work on the Internet. Content from All American Investor has been syndicated on Reuters, the Wall Street Journal, Fox News, Pluck, Blog Critics, and a growing list of newspaper websites. Bob is actively seeking syndication and writing assignments. |
Follow All American Investor on Twitter
No comments:
Post a Comment