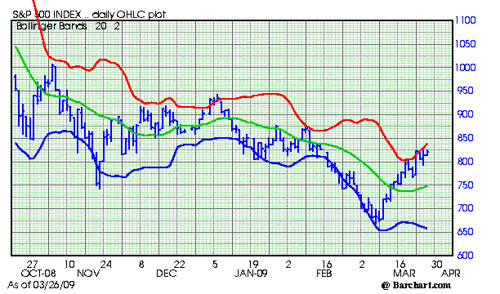
This S and P chart continues to show that technical resilience is building. The S and P is still in a range expansion and this indicates that volatility could pick up at any time. The red line (plus two standard deviations) is sloping up and the market is continuing to hug the line. All short term positives.
The other day we mentioned that there was considerable resistance and congestion in the 825 area. The market continues trying to attack this area. There is more upside potential on a short term basis then we had a few days ago, now up to the 850 area. Good support is down around 750 and is rising.
Bulls should be a bit cautious right now. If the market can't get firmly through 825 soon, the market might be ripe for a further test of the downside to establish support.
Short term still looks good to me.
Subscribe to All American Investor via Email
 Bob DeMarco is a citizen journalist and twenty year Wall Street veteran. Bob has written more than 500 articles with more than 11,000 links to his work on the Internet. Content from All American Investor has been syndicated on Reuters, the Wall Street Journal, Fox News, Pluck, Blog Critics, and a growing list of newspaper websites. Bob is actively seeking syndication and writing assignments. Bob DeMarco is a citizen journalist and twenty year Wall Street veteran. Bob has written more than 500 articles with more than 11,000 links to his work on the Internet. Content from All American Investor has been syndicated on Reuters, the Wall Street Journal, Fox News, Pluck, Blog Critics, and a growing list of newspaper websites. Bob is actively seeking syndication and writing assignments. |
Follow All American Investor on Twitter
More from All American Investor
No comments:
Post a Comment