Showing posts with label bear. Show all posts

Sunday, November 08, 2009

Bear Stearns Trash Still in the FED Roach Motel (Graph)


On June 26, 2008, the Federal Reserve Bank of New York (FRBNY) extended credit to Maiden Lane LLC under the authority of section 13(3) of the Federal Reserve Act. This limited liability company was formed to acquire certain assets of Bear Stearns and to manage those assets through time to maximize repayment of the credit extended and to minimize disruption to financial markets.


Subscribe to All American Investor via Email

Kindle: Amazon's 6" Wireless Reading Device


Original content Bob DeMarco, All American Investor

Thursday, April 09, 2009

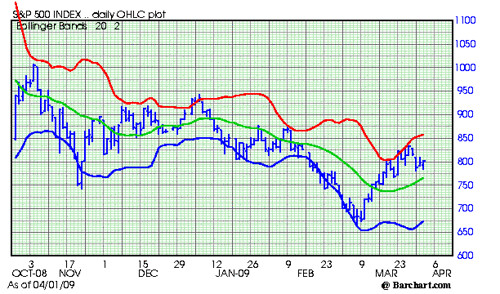
Stocks the Nervous Norvis Market (Chart and View)


There are a lot of Nervous Norvises out there.

When the market moves down for a couple of days your typical Nervous Norvis bull gets sweaty palms and heart palpitations. A couple of days down and the bears are pounding their chest. The only thing the bears can think about is bad news. Left to wonder of course, why is the market going up with all this bad news--the world is coming to an end.

Stocks the Nervous Norvis Market

The Stock market is in a classic uptrend from the capitulation low.

Review:
At the moment:
  • The market continues to make higher lows. The most important ingredient of a trend.
  • The market found support on a dip three times. This indicates there are buyers below the market. This is necessary to raise confidence.
  • Bears continue to try and sell the market. The big difference they are running for cover at the first sign of strength.
  • The slope of the green line (midpoint, support) continues to point up and is strengthening.
  • The blue line is picking up momentum and as long as this continues it will help propel the market higher,
  • The market is once again approaching the red line (two standard deviations up) and this should be watched. Short term traders should resist the urge to buy the market when it is at, near, or above the red line. This is where nervous norvises really get killed.
  • There is still substantial resistance from 850-875. This is where the market will likely wear out bulls who lack patience. They will get out and will likely start chasing it right into the top and before the next major test of the downside.
Subscribe to All American Investor via Email


Bob DeMarco is a citizen journalist and twenty year Wall Street veteran. Bob has written more than 500 articles with more than 11,000 links to his work on the Internet. Content from All American Investor has been syndicated on Reuters, the Wall Street Journal, Fox News, Pluck, Blog Critics, and a growing list of newspaper websites. Bob is actively seeking syndication and writing assignments.


More from All American Investor


Follow All American Investor on Twitter

Wednesday, April 01, 2009

S & P 500 Stress Test for the Bears


S and P 500, Chart, Daily, Midday.

S & P 500 Stress Test

Highlights:
  • It is early in the day but the market made a new low, below yesterday's low, reversed, and is now clawing its way back over 800. A positive short term development.
  • The chart gap is still in play. The S & P needs to trade to 813.43 to fill the gap. This area should be watched closely.
  • Trading is slow so far. However, it the market closes above that gap the bears will be forced to run for cover.
  • A close above yesterday's high of 810.48 would give us an outside up day. That would be very bullish. It would also give us another hook up in the chart.
  • We need to watch closely to be sure support is building below the market. A pattern of higher highs and higher lows is what we are looking for to remain bullish.
In spite of all the bear chatter and shorting in the market, the S and P is only 30 points from the high for this move--made last week. A move above yesterday's high will put extreme pressure on the bears.

Looks like a bear stress test to me so far.
Subscribe to All American Investor via Email

Bob DeMarco is a citizen journalist and twenty year Wall Street veteran. Bob has written more than 500 articles with more than 11,000 links to his work on the Internet. Content from All American Investor has been syndicated on Reuters, the Wall Street Journal, Fox News, Pluck, Blog Critics, and a growing list of newspaper websites. Bob is actively seeking syndication and writing assignments.


More from All American Investor


Sunday, March 29, 2009

Bear Markets Revisited 1929-1933


This is a update of an article I put up on March 18. Since then, the current bear market rally that started on March 9, around 676 area has extended itself to about 20 percent. In the chart below you will notice that bear market rallies averaged 30 percent from 1929-1933. The bear market rallies averaged about two months in duration. It is always interesting and educational to study the past. A friend of mine pointed out that the market dropped like a lead brick many times during that period, and that the low made in 1929 was not the low of the bear market.

File this under food for thought, and looking beyond the obvious.

The following lists the bear market rallies, and the duration, from 1929-1933.


The following list the bear market rallies, and the duration, from 2007- to the present.

Good information and perspective that I picked up over on FT Alphaville.
Subscribe to All American Investor via Email

Follow All American Investor on Twitter

Monday, March 09, 2009

Doctor Doom Nouriel Roubini: Stock Market to Go Much Lower


http://allamericaninvestor.blogspot.com/2009/03/doctor-doom-nouriel-roubini-stock.htmlThis is directly from an email I received from the RGE Monitor.

Roubini of RGE Monitor: Stock Market to Go Much Lower

Can we rule out another bear market rally some time in 2009?
No, we cannot rule out another bear market sucker’s rally in 2009, most likely in Q2 or Q3. The drivers of this rally will be the improvement in second derivatives of economic growth and activity in U.S. and China that the policy stimulus will provide on a temporary basis. Given the severity of macro, household, financial firms and corporate imbalances in the U.S. and around the world this Q2 or Q3 sucker’s market rally will fizzle out later in the year like the previous 5 ones in the last 12 months.
Subscribe to All American Investor via Email

What are the downside risks to these bearish predictions for U.S. and global equities?
On the downside there is at least a third probability of an L-shaped global near depression rather than the mere current severe U-shaped recession. If a near depression were to take hold globally a 40% to 50% further fall in U.S. and global equities from current levels could not be ruled out. But in this L-shaped near depression the last thing one would have to worry about would be stock markets as more severe issues would have to be addressed.
What are the upside risks to these bearish predictions for U.S. and global equities?
On the upside, we have an aggressive policy stimulus in the U.S. and other countries that might lead to a faster sustained economic and financial markets recovery that expected here. The bullish argument for a non-bear market and early persistent recovery of global equities is based on a better than expected recovery of the U.S. and global economy.
Bottom Line: P/E and S&P Index
Earnings per share (EPS) of S&P 500 firms will be in the $ 50 to 60 range, but they could fall to $40. The price earnings (P/E) ratio may fall in the 10 to 12 range in a U-shaped recession. If earnings are closer to 50 or the P/E ratio falls to 10 then the S&P could fall to 600 (12 x 50 or 10 x 60) or even to 500 (10 x 50). Equivalently the Dow (DJIA) would be at least as low as 7000 and possibly as low as 6000 or 5000.


Nouriel expounded the above topics further at the CBOE 25th Annual Risk Management Conference at Laguna Beach where he was the keynote speaker.

Read more of Nouriel’s and other RGE Monitor analysts’ views on the current economic and financial situation on www.rgemonitor.com or contact sales at info@rgemonitor.com.

Bob DeMarco is a citizen journalist, blogger, and Caregiver. Bob has written more than 500 articles with more than 11,000 links to his work on the Internet. The content has been syndicated on Reuters, the Wall Street Journal, Fox News, Pluck, Blog Critics, and a growing list of newspaper websites. Bob is actively seeking syndication and writing assignments.


More from All American Investor