Gold has a tendency to be seasonally week from March through August. As a result, it is always risky to speculate in gold during this time frame.
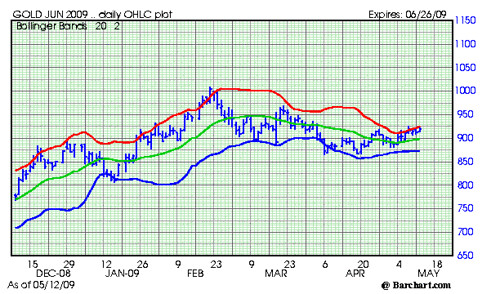
In April, we wrote that gold was likely to test the 865 - 875 area. This happened, the market held, and made a very nice double bottom. This is now an area of major support.
Right now gold is running into resistance in the 827 area.
Any close over 827.50 would indicate that gold is ready to move higher.
Subscribe to All American Investor via EmailThe market place is now starting to focus on the potential inflationary impact of the policies being carried out by the Federal Reserve and Treasury. The money supply, Fed balance sheet, and reserve balances are all soaring. The Treasury is buying mortgage backed securities and treasuries in an attempt to keep interest rates artificially low.
This is a big positive for gold. The marketplace is beginning to sense that a major increase in inflation is on the horizon. Gold is likely to discount this phenomena well in advance.
Gold, like all commodities, goes up when demand increases and supplies get tight. Both are happening right now.
What to watch:
- Purchases of gold by the SPDR Gold Shares -- GLD. The ETF is now the sixth largest holder of gold in the world. When demand for the shares increase their purchases of physical gold increase.
- Demand out of China. This includes buys by the Central Bank and demand for jewelry. Sooner or later demand from China is going to be explosive. While it is not well known, during the last big bull market in gold, much of the upside was fueled by purchases out of Hong Kong.
- Any close over 827.50 basis June Gold.
Background:
- Gold has a tendency to be weak on a seasonal basis at this time of year. This pattern usually persists until summer.
- Industrial and jewelry demand for gold has been slow due to the weakness in the global economy.
- The market experienced some jitters on a rumor of IMF gold sales. This is not happening.
- The market also sold off on news out of India that demand for gold was dropping.
- Seasonal demand patterns in gold are sometimes offset by investor demand for physical gold and ETFs.
- Central banks continue to be large net sellers of Gold. Central banks have been net sellers of gold sales since 1999. Obviously, investor demand has been offsetting these large sales.
Here is some history on gold since 1980.
- Gold rallied from $135 an ounce in 1978 to $860 an ounce in 1980.
- The late 70s-80s gold rush was caused by consumer fears about inflation. The monthly CPI reading reached 1.5 percent in 1980. Gold peaked along with the inflation rate.
- From 1980 until late 1999 gold prices trended down.
- Gold bottomed near $250 an ounce in 1999.
- When gold was making its lows in 1999, most of the major Central Banks around the world announced they intended to sell-off a large fraction of their gold reserves (400 tonnes a year, 2000 tonnes total).
- Central banks are still selling their gold reserves in 2009 (500 tonnes a year, 2500 tonnes total).
- Central banks continue to sell gold and the price continues to rise.
- Since the late 1980s the purchases of gold by institutional investors has been rising. This trend continues and seems to be picking up momentum.
- Demand for gold rose sharply in the fourth quarter of 2008, up 27 percent to $26.7 billion (year over year, Q4-2007 versus Q4- 2008).
 Bob DeMarco is a citizen journalist and twenty year Wall Street veteran. Bob has written more than 500 articles with more than 11,000 links to his work on the Internet. Content from All American Investor has been syndicated on Reuters, the Wall Street Journal, Fox News, Pluck, Blog Critics, and a growing list of newspaper websites. Bob is actively seeking syndication and writing assignments.
Follow All American Investor on Twitter