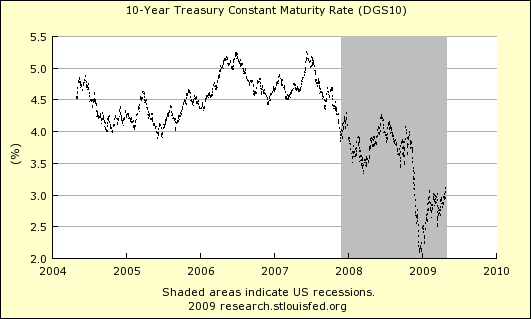
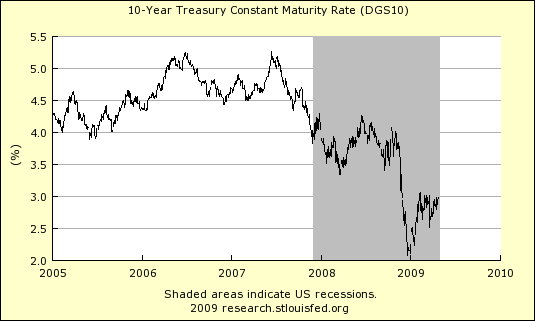
The Ten Year Treasury note peaked at an all time high yield on September 25, 1981 at 15.68 percent. The yield has been falling since that peak. For more than 29 years.....By Bob DeMarco
All American Investor
The Ten Year Treasury note peaked at an all time high yield on September 25, 1981 at 15.68 percent. The yield has been falling since that peak. For more than 29 years.....By Bob DeMarco
Some day -- maybe even soon -- China will turn pessimistic on the U.S. dollar.The threat that China and others countries might divest the dollar is starting to cause jitters in the Treasury market. If the countries Samuelson mentioned held on to their dollar assets --but cut back on their purchases of U.S. Treasuries-- interest rates higher immediately.That means lethal troubles for the future U.S. economy.
When a disorderly run against the dollar occurs, I believe a truly global financial panic is to be feared. China, Japan and Korea now hold dollars not because they think dollars will stay safe.
Why then?.....
Subscribe to All American Investor via Email
 Bob DeMarco is a citizen journalist and twenty year Wall Street veteran. Bob has written more than 700 articles with more than 18,000 links to his work on the Internet. Content from All American Investor has been syndicated on Reuters, the Wall Street Journal, Fox News, Pluck, Blog Critics, and a growing list of newspaper websites. Bob is actively seeking syndication and writing assignments. Bob DeMarco is a citizen journalist and twenty year Wall Street veteran. Bob has written more than 700 articles with more than 18,000 links to his work on the Internet. Content from All American Investor has been syndicated on Reuters, the Wall Street Journal, Fox News, Pluck, Blog Critics, and a growing list of newspaper websites. Bob is actively seeking syndication and writing assignments. |

Subscribe to All American Investor via Email
| Bob DeMarco is a citizen journalist and twenty year Wall Street veteran. Bob has written more than 500 articles with more than 11,000 links to his work on the Internet. Content from All American Investor has been syndicated on Reuters, the Wall Street Journal, Fox News, Pluck, Blog Critics, and a growing list of newspaper websites. Bob is actively seeking syndication and writing assignments. |
 Kindle: Amazon's 6" Wireless Reading Device
Subscribe to All American Investor via Email
| Bob DeMarco is a citizen journalist and twenty year Wall Street veteran. Bob has written more than 500 articles with more than 11,000 links to his work on the Internet. Content from All American Investor has been syndicated on Reuters, the Wall Street Journal, Fox News, Pluck, Blog Critics, and a growing list of newspaper websites. Bob is actively seeking syndication and writing assignments. |
Kindle: Amazon's 6" Wireless Reading Device 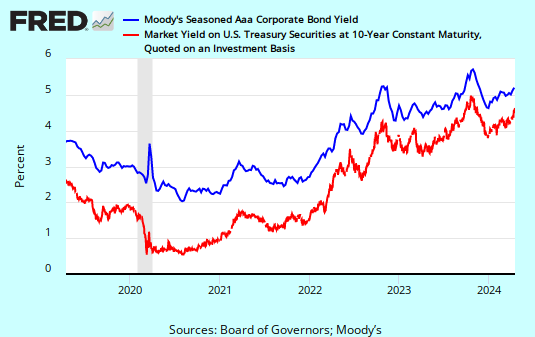
Subscribe to All American Investor via Email

Subscribe to All American Investor via Email
Subscribe to All American Investor via Email
| Bob DeMarco is a citizen journalist and twenty year Wall Street veteran. Bob has written more than 500 articles with more than 11,000 links to his work on the Internet. Content from All American Investor has been syndicated on Reuters, the Wall Street Journal, Fox News, Pluck, Blog Critics, and a growing list of newspaper websites. Bob is actively seeking syndication and writing assignments. |
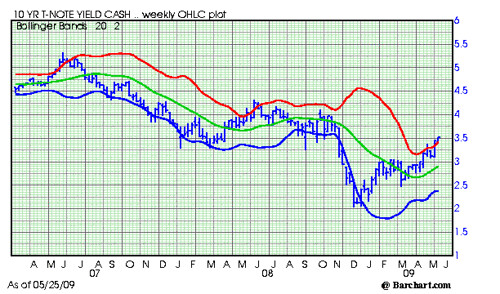
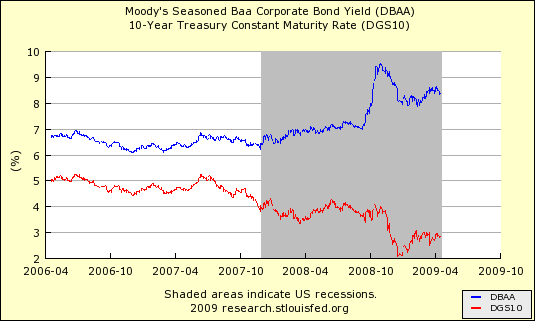
Subscribe to All American Investor via EmailThe market place is now starting to focus on the potential inflationary impact of the policies being carried out by the Federal Reserve and Treasury. The money supply, Fed balance sheet, and reserve balances are all soaring. The Treasury is buying mortgage backed securities and treasuries in an attempt to keep interest rates artificially low.
| Bob DeMarco is a citizen journalist and twenty year Wall Street veteran. Bob has written more than 500 articles with more than 11,000 links to his work on the Internet. Content from All American Investor has been syndicated on Reuters, the Wall Street Journal, Fox News, Pluck, Blog Critics, and a growing list of newspaper websites. Bob is actively seeking syndication and writing assignments. |
Federal Reserve will buy up to $300 billion of Treasury securities by autumn.
Subscribe to All American Investor via Email
| Bob DeMarco is a citizen journalist and twenty year Wall Street veteran. Bob has written more than 500 articles with more than 11,000 links to his work on the Internet. Content from All American Investor has been syndicated on Reuters, the Wall Street Journal, Fox News, Pluck, Blog Critics, and a growing list of newspaper websites. Bob is actively seeking syndication and writing assignments. |
As previously announced, to provide support to mortgage lending and housing markets and to improve overall conditions in private credit markets, the Federal Reserve will purchase a total of up to $1.25 trillion of agency mortgage-backed securities and up to $200 billion of agency debt by the end of the year. In addition, the Federal Reserve will buy up to $300 billion of Treasury securities by autumn. The Committee will continue to evaluate the timing and overall amounts of its purchases of securities in light of the evolving economic outlook and conditions in financial markets. The Federal Reserve is facilitating the extension of credit to households and businesses and supporting the functioning of financial markets through a range of liquidity programs. The Committee will continue to carefully monitor the size and composition of the Federal Reserve's balance sheet in light of financial and economic developments.
Subscribe to All American Investor via Email
Subscribe to All American Investor via Email
Subscribe to All American Investor via Email
| Bob DeMarco is a citizen journalist and twenty year Wall Street veteran. Bob has written more than 500 articles with more than 11,000 links to his work on the Internet. Content from All American Investor has been syndicated on Reuters, the Wall Street Journal, Fox News, Pluck, Blog Critics, and a growing list of newspaper websites. Bob is actively seeking syndication and writing assignments. |
Subscribe to All American Investor via Email
Kindle 2: Amazon's New Wireless Reading Device (Latest Generation)
Follow All American Investor on Twitter
Treasury officials are examining one potential outcome in which the “good G.M.” enters and exits bankruptcy protection in as little as two weeks, using $5 billion to $7 billion in federal financing, a person who had been briefed on the prospect said last week.
The rest of G.M. may require as much as $70 billion in government financing, and possibly more to resolve the health care obligations and the liquidation of the factories, according to legal experts and federal officials.

Subscribe to All American Investor via Email
| Bob DeMarco is a citizen journalist and twenty year Wall Street veteran. Bob has written more than 500 articles with more than 11,000 links to his work on the Internet. Content from All American Investor has been syndicated on Reuters, the Wall Street Journal, Fox News, Pluck, Blog Critics, and a growing list of newspaper websites. Bob is actively seeking syndication and writing assignments. |

