Showing posts with label ten. Show all posts

Monday, May 17, 2010

10-Year Treasury Constant Maturity Rate


Current: 3.55 percent.

Saturday, November 14, 2009

Ten Year Treasury Constant Maturity (Chart)


Subscribe to All American Investor via Email

Kindle: Amazon's 6" Wireless Reading Device


Original content Bob DeMarco, All American Investor

Saturday, June 06, 2009

Ten Year Treasury Yield in Orbit (Graph)


Ten Year Treasury Yield in Orbit (Graph)

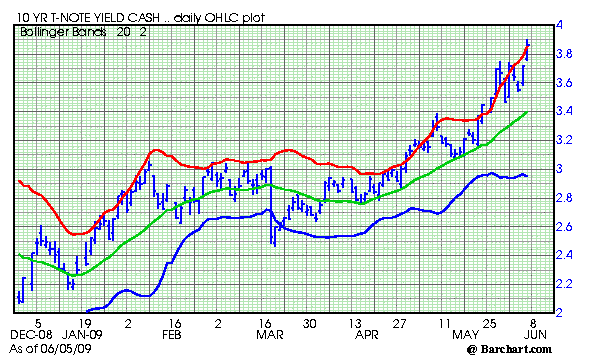
The sharp rise in the Ten Year Treasury note yield will come as no surprise to readers of this blog. We forecasted this development, based on Federal Reserve and Treasury policy, several months ago when we pointed out that once the yield exceeded 3.125 percent, it was up up and away on our beautiful, beautiful money machine.

Our new song is, there ain't no stopping it now. Oh, the Treasury will come in and buy some size in longer dated Treasuries and mortgage back securities, forcing a short lived, temporary drop in rates from time to time.

As you can see if you look at the red line on the chart, this market continues to stay overbought. This is not a negative sign, quite the opposite, it signals the enormous strength of this trend up in interest rates.

Expect the Fed to defend the 4.00% with both hands and both feet. It will be interesting to see if they can stem the tide of rising interest rates in the longer end of the market.

This rise in ten year interest rates has lots of negative implications. However, the single biggest negative is simple --the refinancing boom is over. With mortgage rates well over 5 percent now, the economics won't work for the vast number of mortgage owners that refinanced in prior drops into the current area.
Subscribe to All American Investor via Email


Bob DeMarco is a citizen journalist and twenty year Wall Street veteran. Bob has written more than 500 articles with more than 11,000 links to his work on the Internet. Content from All American Investor has been syndicated on Reuters, the Wall Street Journal, Fox News, Pluck, Blog Critics, and a growing list of newspaper websites. Bob is actively seeking syndication and writing assignments.


More from All American Investor


Kindle: Amazon's 6" Wireless Reading Device

Wednesday, May 27, 2009

Ten Year Interest Rates Rising (Chart)


Ten Year, Interest Rate View, Chart, Monthly Bar Chart

Ten Year Note 527


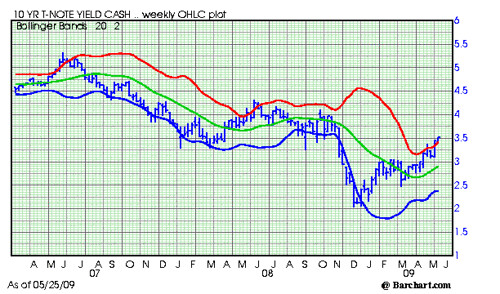
The Ten Year Note interest rate continues to rise. Right now, it is somewhat overbought.

Long term interest are on the rise. The FED continues to try and hold interest rates down. This is reflected by the steepening of the yield curve.

The bad news here is that mortgage rates are driven by the ten year yield and are now above five percent.
Subscribe to All American Investor via Email


Bob DeMarco is a citizen journalist and twenty year Wall Street veteran. Bob has written more than 500 articles with more than 11,000 links to his work on the Internet. Content from All American Investor has been syndicated on Reuters, the Wall Street Journal, Fox News, Pluck, Blog Critics, and a growing list of newspaper websites. Bob is actively seeking syndication and writing assignments.


Kindle: Amazon's Wireless Reading Device (Latest Generation)


Follow All American Investor on Twitter

Friday, May 01, 2009

Ten Year Treasury Should Worry Investors (Chart)


Ten Year Treasury Constant Maturity

For several weeks, I have been writing about longer dated Treasury securities and the importance of paying attention to interest rates if you are an investor.

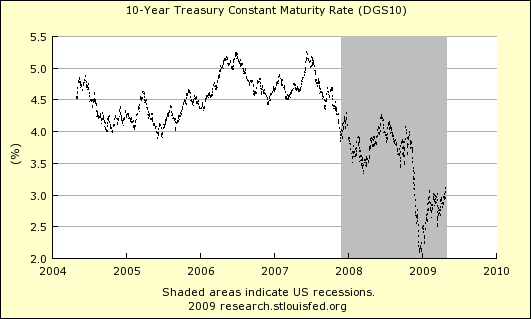
The ten year Treasury interest rate is moving up fast. This week it challenged and broke the important 3.125 area. At the same time, the FOMC reaffirmed its intention of buying treasury securities in size.
Federal Reserve will buy up to $300 billion of Treasury securities by autumn.
The Fed can hold down short term interest rates until inflation picks up. However, the Fed cannot hold down long term interest.

I also posted charts  showing the growth of the Fed's balance sheet and the explosive growth in money supply.

The bond vigilantes are coming back. Soon this will be the talk of the town. And, discussion about inflation and risk premiums will bring new jitters into the stock market.

You heard it here first.

Ten Year Treasury 501
Subscribe to All American Investor via Email


Bob DeMarco is a citizen journalist and twenty year Wall Street veteran. Bob has written more than 500 articles with more than 11,000 links to his work on the Internet. Content from All American Investor has been syndicated on Reuters, the Wall Street Journal, Fox News, Pluck, Blog Critics, and a growing list of newspaper websites. Bob is actively seeking syndication and writing assignments.


More from All American Investor


Follow All American Investor on Twitter

Tuesday, April 07, 2009

Ten Year Treasury Perspective (Chart)


Ten Year Treasyry 406


Notes:
  • Every time I look at this chart I think about 1978-82.
  • During that period it was not unusual to watch the 3 month Treasury bill move 50 basis points in a day.
  • On a slow day the trading range in the Ten Year was a point and one-half.
  • Interest Rates on the Ten Year Treasury rose over 15 percent. Mortgage rates also moved above 15 percent.
  • Everyone was so bearish they wouldn't touch the Ten Year or Long Bond.
  • I continue to ask myself, will we see double digit ten year Treasury rates again?
  • The obvious answer is, YES.
  • Flash forward 30 years.
  • The Ten Year is trading at 2.91 percent. Will rates ever go up?
  • It looks like the Ten Year is making a low in this area.
  • A close above 3.125 percent would indicate higher interest rates and a trend change.
  • I learned a long time ago that trends start when you least expect them.
  • Once a trend starts it tends to persist for a long time.
  • One thing I know for sure -- rates always go a lot lower, and a lot higher than you could have ever expected--at the extremes.
  • Investors should be thinking about ways to take advantage of increases in interest rates.
  • Once rates start up they should do so for many years.
Subscribe to All American Investor via Email
Bob DeMarco is a citizen journalist and twenty year Wall Street veteran. Bob has written more than 500 articles with more than 11,000 links to his work on the Internet. Content from All American Investor has been syndicated on Reuters, the Wall Street Journal, Fox News, Pluck, Blog Critics, and a growing list of newspaper websites. Bob is actively seeking syndication and writing assignments.

Saturday, March 28, 2009

Ten Year Treasury Chart, 1962 to the present


Ten Year Treasury Constant Maturity

Link to the Chart.

APPLE (AAPL) or NVIDIA (NVDA) which was the Better Buy? (Chart)


Chart, APPLE (AAPL) versus NVIDIA (NVDA), Ten Year Chart, Comparison, Monthly Percent Change.

Apple Versus Nvidia percent change 328


From 2000 to late 2003, Apple traded sideways in a tight range. You had plenty of time to understand the implications of the MAC and the IPod. Kids were begging for the IPod long before the stock took off to the upside.

For most of the decade, NVDA would have been the better buy.

Apple was clearly the better buy over the entire ten year period. However, compared to the market return of most stocks over this same time frame, both Apple and Nvidia were good buys. Of late NVDA is taking off to the upside.
Subscribe to All American Investor via Email
Follow All American Investor on Twitter

Tuesday, March 24, 2009

Gold Ten Year Chart and Highlights


Cash Gold Monthly Chart 324

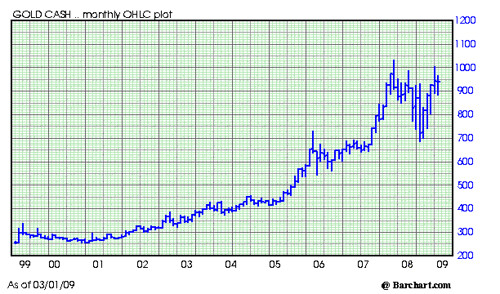
This is the cash chart for Gold. Each Bar equals one month. Time frame, 1999-2009.

Some Gold Chart facts:
  • The low in Gold was made during March, 2001 around the 255.00 level.
  • The high in Gold was made during March, 2008 around the 1,032.00 level.
  • Every year from 2001 to 2008, Gold made a new high for the move.
  • Gold plunged for most of 2008 and made its low during October, 2008 around the 682.00 level.
  • Gold touched 1,000 for the second time February, 2009.
  • Seasonal demand for Gold is low during the Spring months.
  • Seasonal demand for Gold is usually very strong in the second half of the year.
We will be issuing a new report soon on the seasonal tendencies for gold. We will also discuss specific supply/demand factors that effect the price of gold.

If you are interested in receiving more information on Gold from All American Investor you can subscribe free via email, RSS, or Twitter.
Subscribe to All American Investor via Email

Monday, March 23, 2009

Frontline: Ten Trillion and Counting


All of the federal government’s efforts to stem the tide in the financial meltdown that began with the subprime mortgage crisis have added hundreds of billions of dollars to our national debt. FRONTLINE reports on how this debt will constrain and challenge the new Obama administration, and on the growing chorus on both sides of the aisle that without fiscal reform, the United States government may face a debt crisis of its own which makes the current financial situation pale in comparison. Through interviews with leading experts and insiders in government finance, the film investigates the causes and potential outcomes of—and possible solutions to—America’s $10 trillion debt.


Airs on television and online starting March 24. Go here to check the schedule.
Subscribe to All American Investor via Email

Saturday, February 28, 2009

10-Year Treasury Constant Maturity Rate


Ten year Treasury yields are at their lowest levels in more than 45 years. You will notice the peak yield, above 15 percent, occurred in 1982. File this one under food for thought. Click the link in the chart for the larger view or to change the time frame.