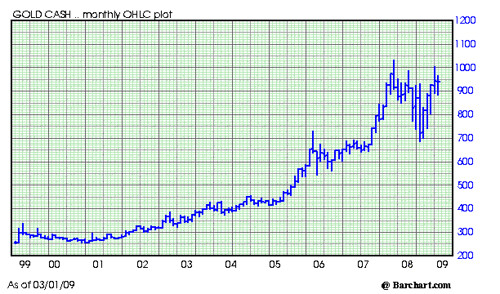
This is the cash chart for Gold. Each Bar equals one month. Time frame, 1999-2009.
Some Gold Chart facts:
- The low in Gold was made during March, 2001 around the 255.00 level.
- The high in Gold was made during March, 2008 around the 1,032.00 level.
- Every year from 2001 to 2008, Gold made a new high for the move.
- Gold plunged for most of 2008 and made its low during October, 2008 around the 682.00 level.
- Gold touched 1,000 for the second time February, 2009.
- Seasonal demand for Gold is low during the Spring months.
- Seasonal demand for Gold is usually very strong in the second half of the year.
If you are interested in receiving more information on Gold from All American Investor you can subscribe free via email, RSS, or Twitter.
Subscribe to All American Investor via Email
No comments:
Post a Comment