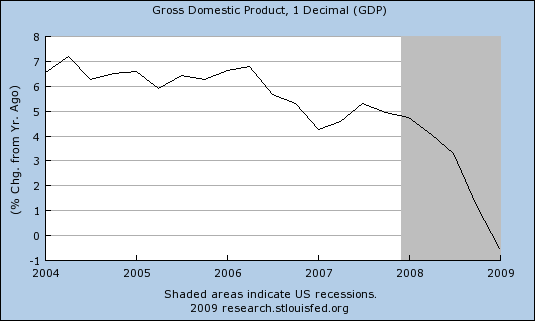
The chart shows GDP as percent change from a year ago. The trend is clearly down. This chart shows a different picture than looking at quarterly change, and comparing GDP numbers quarter by quarter.
The quarterly chart shows GDP improving from down 6.3 percent, to down 6.1 percent. A quick look at those numbers could easily lead one to believe that GDP is improving. Is down 6.1 percent really better than down 6.3 percent?
Keep in mind, retail sales make up about two thirds of GDP.
Follow All American Investor on Twitter
Subscribe to All American Investor via Email
Follow All American Investor on Twitter
No comments:
Post a Comment