Showing posts with label commodity. Show all posts

Monday, May 11, 2009

Commodities Ready to Soar on Upside Breakout (Chart)


Goldman Sachs Commodity Index, Weekly Bar.

I decided to use the weekly chart so you can get a better long term perspective.


The daily GSCI chart broke out to the upside on a close over 380. The weekly chart is now breaking out with a close over 400. Next upside target is 460. This might not seem like much, but it is 15 percent. The GSCI is currently over bought so there could be some chopping around before we head sharply higher.

I have been posting the charts on money supply, the FED balance sheet, and reserves for months. They all look like a gushing oil well. I wrote some time ago that it usually takes 12-18 months for these effects to bring inflation. We are now inside those windows.

I am also following long term interest rates. The Fed was in buying size and this caused a short term back up in prices. This will be a short term phenomena. A real battle is brewing between the FED and the bond vigilantes. The FED has used about 30 percent of their announced bullets already.

Expect commodity prices to trend higher over the next several years.

A good look at the GSCI chart shows a 2008 high near 900 on the upside. Since the GSCI is heavily weighted in oil, it is likely that a long list of commodities will make new highs before oil.
Subscribe to All American Investor via Email
Bob DeMarco is a citizen journalist and twenty year Wall Street veteran. Bob has written more than 500 articles with more than 11,000 links to his work on the Internet. Content from All American Investor has been syndicated on Reuters, the Wall Street Journal, Fox News, Pluck, Blog Critics, and a growing list of newspaper websites. Bob is actively seeking syndication and writing assignments.


Follow All American Investor on Twitter

Tuesday, April 14, 2009

Copper Soaring, China Buying (Chart)


Cash Copper, Daily Price Mark

Cash Copper Chart 414

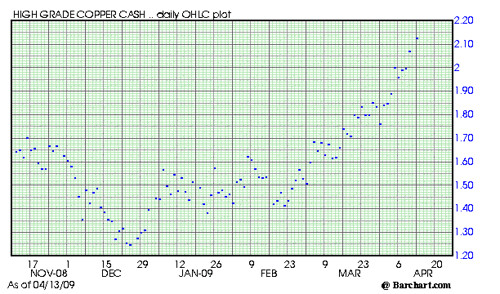
The chart contains a single price (dot) for each trading day.

Notes:
  • The price of copper is moving up fast. This is being caused by buying out of China.
  • China is a large importer of cooper. They import about 85 percent of their need.
  • On December 24, copper traded at the low price of 124.75.
  • Today the price was marked at 212.55.
  • The price of copper has risen 70 percent in the last 4 months.
You should be looking at Freeport McMoran (FCX).  Freeport benefits from rises in the price of copper. The company is also a large producer of gold. We will cover Freeport McMoran tommorow.

You should note the effect that demand from China can have  on commodity prices. One theme that should become evident is that when China starts to demand the supply of a commodity its price is likely to rise dramatically. This will create lots of opportunites for smart investors.

There are several ways to take advantage of thirsty demand for commodities from China. These include: sector stocks, ETFs, options, and commodity futures contracts.

We will be honing in on these opportunities in the days and weeks ahead.

So stay tuned daily.
Subscribe to All American Investor via Email

Bob DeMarco is a citizen journalist and twenty year Wall Street veteran. Bob has written more than 500 articles with more than 11,000 links to his work on the Internet. Content from All American Investor has been syndicated on Reuters, the Wall Street Journal, Fox News, Pluck, Blog Critics, and a growing list of newspaper websites. Bob is actively seeking syndication and writing assignments.


Follow All American Investor on Twitter

Monday, April 13, 2009

Goldman Commodity Index Ready to Blast Off (Chart)


Goldman Sachs Commodity Index (Cash)

Goldman Sachs Commodity Index

Notes:
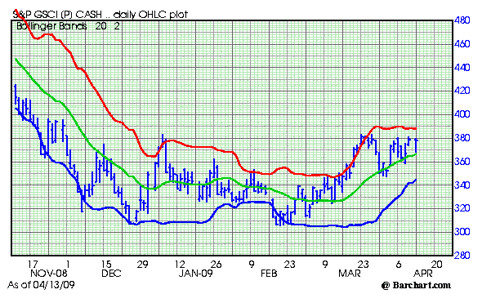
  • The Goldman Sachs Commodity Index is heavily weighted in oil
  • The index is trying to claw its way above 380. This dates back to January.
  • The current formation is bullish.
  • Most times when a market continues to return to a area over and over, on the upside, it is an indication that the market wants to move in that direction.
  • Expect a break out to higher levels in short order.


Subscribe to All American Investor via Email


Bob DeMarco is a citizen journalist and twenty year Wall Street veteran. Bob has written more than 500 articles with more than 11,000 links to his work on the Internet. Content from All American Investor has been syndicated on Reuters, the Wall Street Journal, Fox News, Pluck, Blog Critics, and a growing list of newspaper websites. Bob is actively seeking syndication and writing assignments.


More from All American Investor


Follow All American Investor on Twitter
Monday, March 23, 2009

Goldman Sachs Commodity Index Soaring (Chart)


The chart below is of the Goldman Sachs Commodity Index (GSCI).

Goldman Sachs Commodity Index 323

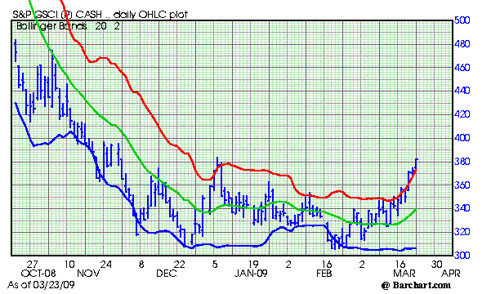
The Goldman Sachs Commodity Index is soaring up. This is a good proxy of inflation and should be watched closely in the weeks and months ahead.

It should be noted that the GSCI is heavily weighted in oil. This is for good reason, oil is the single largest commodity in the world.

Two things to note in the chart:
  • The GSCI is currently overbought as evidenced by the red line. Anytime a market trades above the red line it is overbought on a short term basis.
  • The GSCI is coming into a major resistance--380-400.
If the 400 area clears, likely, there is more resistance in the 420 area.

The GSCI made its current low for the move last month at 305.85. The high occurred during July, 2008 at 893.85.

If you can't invest in commodity futures, you should be looking for stocks that benefit from inflation. Inflation type stocks should do very well in this environment.
Subscribe to All American Investor via Email


Saturday, February 28, 2009

Money Supply, M2, Year over Year Change


Money supply is growing very fast. It has not yet had an impact on inflation. Delays in this effect usually take 12-18 months. The last trough in M2 occurred in December, 2007. Since then, M2 has been growing at an unprecedented pace.

It should be clear from the chart that the Federal Reserve Board has decided that deflation and the current financial crisis are more important that the risk of inflation.

Most forecaster see no inflation problem on the horizon. Many of these same forecasters didn't see a problem in housing. Of course, they failed to add in other components like consumer debt and the unprecedented leveraging of bank and Wall Street balance sheets.

I like to watch stocks like MOO to get a feel about inflation. Gold and MOO are telling a very different story than that being told on television.

By now you may have realized that the more things change the more they stay the same. This unprecedented growth in M2 will lead to a pick up in demand. It is only going to take a small incremental increase in demand for commodities to send the inflation indexes up. We already had a taste of this before the bubble burst.

A picture is worth a thousand words. You are looking at money stock. Think of it as fuel. Commodity prices should be rising soon--lets say in the second half of the year.