Showing posts with label manufacturing. Show all posts

Monday, May 21, 2012

The Morning Call + Subscriber Alert + A classic Dow Sell signal


The Market
Technical

Monday Morning Chartology


As you can see, the S&P is approaching a range with multiple support levels. With this kind of congestion, I expect a slow down in the rate of decline and, hopefully, the establishment of a new lower boundary of its short term trading range.


GLD makes a great rebound. Notice the similarity to the late December/early January sell off and bounce.
http://www.zerohedge.com/news/why-has-gold-fallen-price-and-what-outlook

Wednesday, September 02, 2009

Manufacturing ISM Report On Business (NAPM, Graph)


The Institute for Supply Management factory index (ISM)index rose to 52.9% in August, the first time the index has been above 50% since the early days of the recession in January 2008.


"The year-and-a-half decline in manufacturing output has come to an end, as 11 of 18 manufacturing industries are reporting growth when comparing August to July. While this is certainly a positive occurrence, we have to keep in mind that it is the beginning of a new cycle and that all industries are not yet participating in the growth. The August index of 52.9 percent is the highest since June 2007. The 4 percentage point increase was driven by significant strength in the New Orders Index, which is up 9.6 points to 64.9 percent, the highest since December 2004. The growth appears sustainable in the short term, as inventories have been reduced for 40 consecutive months and supply chains will have to re-stock to meet this new demand."
Subscribe to All American Investor via Email
WHAT RESPONDENTS ARE SAYING ...

  • "Production is picking up as demand [for] orders is being accelerated." (Nonmetallic Mineral Products)
  • "Demand from automotive manufacturers increasing thanks to 'Cash for Clunkers.'" (Fabricated Metal Products)
  • "In addition to improved business come the complications of a supply chain drained of inventory." (Paper Products)
  • "The sudden increase in customer demand, plus the low inventories held at services centers, is causing a shortage in the supply of raw steel." (Transportation Equipment)
  • "[It] appears customers' inventories are getting low, and they are cautiously placing orders." (Apparel, Leather & Allied Products)
PMI

Manufacturing's 18 consecutive months of decline ended in August as the PMI registered 52.9 percent, which is 4 percentage points higher than the 48.9 percent reported in July. This is the highest reading since June 2007, when the index also registered 52.9 percent. A reading above 50 percent indicates that the manufacturing economy is generally expanding; below 50 percent indicates that it is generally contracting.

A PMI in excess of 41.2 percent, over a period of time, generally indicates an expansion of the overall economy. Therefore, the PMI indicates growth for the fourth consecutive month in the overall economy, as well as expansion in the manufacturing sector for the first time since January 2008. Ore stated, "The past relationship between the PMI and the overall economy indicates that the average PMI for January through August (42.2 percent) corresponds to a 0.3 percent increase in real gross domestic product (GDP). However, if the PMI for August (52.9 percent) is annualized, it corresponds to a 3.7 percent increase in real GDP annually."


Bob DeMarco is a citizen journalist and twenty year Wall Street veteran. Bob has written more than 700 articles with more than 18,000 links to his work on the Internet. Content from All American Investor has been syndicated on Reuters, the Wall Street Journal, Fox News, Pluck, Blog Critics, and a growing list of newspaper websites. Bob is actively seeking syndication and writing assignments.


Kindle: Amazon's 6" Wireless Reading Device

Thursday, July 02, 2009

Capacity Utilization (Graph)


This graph, a lagging indicator, tells us the economy is in for a long period of slow growth.

When people are sitting around on the beach, instead of working, this is not a sign of the "good old days".

PMI Composite Index (ISM, NAPM, Graph)


Subscribe to All American Investor via Email

Bob DeMarco is a citizen journalist and twenty year Wall Street veteran. Bob has written more than 700 articles with more than 18,000 links to his work on the Internet. Content from All American Investor has been syndicated on Reuters, the Wall Street Journal, Fox News, Pluck, Blog Critics, and a growing list of newspaper websites. Bob is actively seeking syndication and writing assignments.


More from All American Investor


Follow All American Investor on Twitter

Wednesday, June 03, 2009

ISM | Non-Manufacturing Business Activity Index Drops (Graph)


The series below, the NMI Business Activity Index, shows a different picture of the economy than the more popular and more widely publicized NMI (Non-Manufacturing Index). The NMI rose .3 of a percent to 44. The BSI registered a 2.8 percent drop.

Business Activity

ISM's Non-Manufacturing Business Activity Index in May registered 42.4 percent, a decrease of 2.8 percentage points when compared to the 45.2 percent registered in April. Six industries reported increased business activity, and 10 industries reported decreased activity for the month of May. Two industries reported no change from April. Comments from respondents include: "Many initiatives and plans on hold"; and "Delay in start date of new client projects."

The industries reporting growth of business activity in May — listed in order — are:
  • Real Estate, Rental & Leasing; Utilities; Construction; Retail Trade; Arts, Entertainment & Recreation; and Accommodation & Food Services.
  • The industries reporting decreased business activity in May — listed in order — are: Mining; Other Services; Agriculture, Forestry, Fishing & Hunting; Health Care & Social Assistance; Finance & Insurance; Educational Services; Wholesale Trade; Transportation & Warehousing; Professional, Scientific & Technical Services; and Public Administration.
Subscribe to All American Investor via Email

Bob DeMarco is a citizen journalist and twenty year Wall Street veteran. Bob has written more than 500 articles with more than 11,000 links to his work on the Internet. Content from All American Investor has been syndicated on Reuters, the Wall Street Journal, Fox News, Pluck, Blog Critics, and a growing list of newspaper websites. Bob is actively seeking syndication and writing assignments.

Saturday, May 02, 2009

Institute for Supply Management (ISM) , Chart


ISM Manufacturing Composite Monthly (NAPM, May Release)

Nice up tick in the number from 36.3 to 40.1 percent. The low reading for the move was in December at 32.9 percent.

Some encouraging news, the new orders index rose to 47.2 percent.

ISM Manufacturing 501


"The decline in the manufacturing sector continues to moderate. After six consecutive months below the 40-percent mark, the PMI, driven by the New Orders Index at 47.2 percent, shows a significant improvement. While this is a big step forward, there is still a large gap that must be closed before manufacturing begins to grow once again. The Customers' Inventories Index indicates that channels are paring inventories to acceptable levels after reporting inventories as 'too high' for eight consecutive months. The prices manufacturers pay for their goods and services continue to decline; however, copper prices have bottomed and are now starting to rise. This is definitely a good start for the second quarter."
Subscribe to All American Investor via Email


Bob DeMarco is a citizen journalist and twenty year Wall Street veteran. Bob has written more than 500 articles with more than 11,000 links to his work on the Internet. Content from All American Investor has been syndicated on Reuters, the Wall Street Journal, Fox News, Pluck, Blog Critics, and a growing list of newspaper websites. Bob is actively seeking syndication and writing assignments.


Follow All American Investor on Twitter

Friday, April 24, 2009

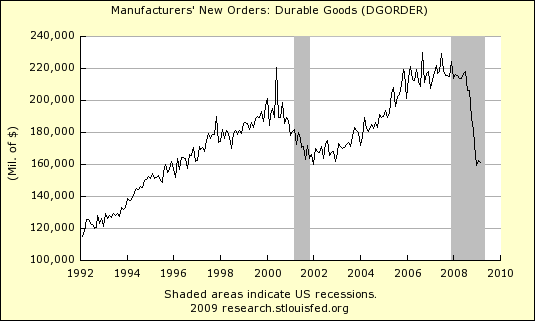
Durable Goods Hanging by a Thread (Graph)


Manufacturers' New Orders: Durable Goods, Monthly, Millions of Dollars, Seasonally Adjusted

Durable Goods 424

The current reading is 161,192 versus 162,482 (in millions). The low reading so far was 159,187 versus the high 219,286. That equals 60,099 millions.

I shudder to think what is going to happen if this series makes new lows. Bad news? If you look at the chart we are hanging by a thread. Good news? The worst might be behind us.
Subscribe to All American Investor via Email

Wednesday, April 15, 2009

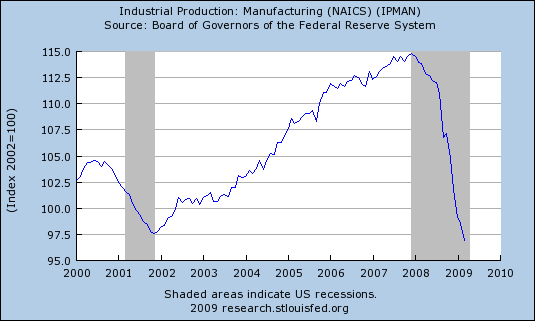
Industrial Production Manufacturing (NAICS, Chart)


Inustrial Production, Manufacturing

Industrial Production Manufacturing 415

Subscribe to All American Investor via Email

Bob DeMarco is a citizen journalist and twenty year Wall Street veteran. Bob has written more than 500 articles with more than 11,000 links to his work on the Internet. Content from All American Investor has been syndicated on Reuters, the Wall Street Journal, Fox News, Pluck, Blog Critics, and a growing list of newspaper websites. Bob is actively seeking syndication and writing assignments.

Kindle 2: Amazon's New Wireless Reading Device (Latest Generation)

Follow All American Investor on Twitter

Wednesday, April 01, 2009

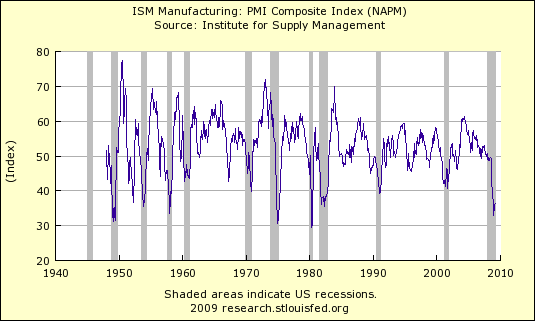
ISM Manufacturing, NAPM (60 Year Chart)


Current reading 36.3, Previous reading 35.8

ISM 401
Subscribe to All American Investor via Email
Follow All American Investor on Twitter