For the better part of 10 years running, all that glitters has, in fact, been gold. Since 2001, the precious metal has outperformed all of the core asset classes, gaining an average 15.3% per year in dollar terms since January 2001.
Showing posts with label trend. Show all posts
Showing posts with label trend. Show all posts
Wednesday, July 21, 2010
Friday, September 04, 2009
Unemployment Trend Remains Ugly (Graph)
Savvy investors understand that the market usually bottoms and turns up long before unemployment peaks. In other words, the market discounts the bad news in advance. So it is easy to understand how the market can rally in spite of the negative unemployment report.
There has not been much discussion about the number of people that are falling off the unemployment insurance payrolls each month. Another 1.5-2 million people will stop getting checks by the end of the year. Unless, of course, these benefits are extended. Additionally, the civilian labor force is dropping or the numbers would be much worse.
We will discuss the growing number of people that have been unemployed 27 weeks or longer, and the real unemployment rate shortly.
The uptrend in unemployment is still strong as evidence by this chart.

Kindle: Amazon's 6"  Wireless Reading Device
Original content Bob DeMarco, All American Investor
There has not been much discussion about the number of people that are falling off the unemployment insurance payrolls each month. Another 1.5-2 million people will stop getting checks by the end of the year. Unless, of course, these benefits are extended. Additionally, the civilian labor force is dropping or the numbers would be much worse.
We will discuss the growing number of people that have been unemployed 27 weeks or longer, and the real unemployment rate shortly.
The uptrend in unemployment is still strong as evidence by this chart.
Subscribe to All American Investor via Email
 Bob DeMarco is a citizen journalist and twenty year Wall Street veteran. Bob has written more than 700 articles with more than 18,000 links to his work on the Internet. Content from All American Investor has been syndicated on Reuters, the Wall Street Journal, Fox News, Pluck, Blog Critics, and a growing list of newspaper websites. Bob is actively seeking syndication and writing assignments. Bob DeMarco is a citizen journalist and twenty year Wall Street veteran. Bob has written more than 700 articles with more than 18,000 links to his work on the Internet. Content from All American Investor has been syndicated on Reuters, the Wall Street Journal, Fox News, Pluck, Blog Critics, and a growing list of newspaper websites. Bob is actively seeking syndication and writing assignments. |
Wireless Reading Device Original content Bob DeMarco, All American Investor
Tuesday, June 02, 2009
Gold | Fourth Time Up the Charm (Chart)
Gold, Cash, Monthly, Chart
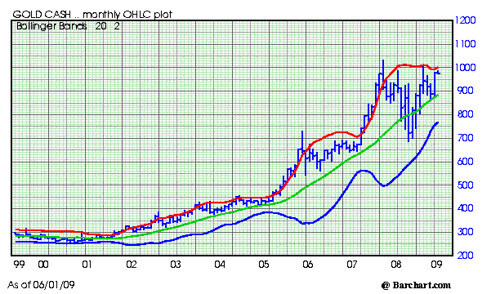
There is a saying in technical trading that the fourth time up is the charm.
As you can see by looking at the Gold Chart, this is the fourth time up.
I am a little surprised by the rise in Gold at this time of year.
A close in Gold over 1,067.50 is likely to lead to an explosive up leg in gold. I am expecting this to happen, and the rise could very well be much higher than is currently being forecast by most.
I wrote previously about how I expect the buying of Gold out of Hong Kong to be enormous once the bull leg gets underway.
There is a saying in technical trading that the fourth time up is the charm.
As you can see by looking at the Gold Chart, this is the fourth time up.
I am a little surprised by the rise in Gold at this time of year.
- The more normal seasonal pattern is for Gold to peak in February - March.
- After the seasonal peak, Gold normally trades down into the August - October period.
- The strongest trading period for Gold normally occurs from October into March.
- The seasonal pattern tells me that Gold is likely to take a rest.
- On the other hand, the market looks very strong, technically, right now.
A close in Gold over 1,067.50 is likely to lead to an explosive up leg in gold. I am expecting this to happen, and the rise could very well be much higher than is currently being forecast by most.
I wrote previously about how I expect the buying of Gold out of Hong Kong to be enormous once the bull leg gets underway.
Back in the bull market of 1978 - 1980, Gold was often up sharply at the U.S. open based on large buying out of Hong Kong. Buying power from the China mainland should be a major factor in the price of gold in the year ahead. The buying is already picking up some momentum.
My experience tells me Gold is due for another correction back toward the 925 area -- the typical seasonal pattern. On the other hand, a break above this existing top could lead to a monster rally.
Long term gold traders should be patient and let it happen. Buyers of Gold stocks should see gains like they have rarely seen in the year ahead.
More from All American Investor
Kindle: Amazon's Wireless Reading Device (Latest Generation)
My experience tells me Gold is due for another correction back toward the 925 area -- the typical seasonal pattern. On the other hand, a break above this existing top could lead to a monster rally.
Long term gold traders should be patient and let it happen. Buyers of Gold stocks should see gains like they have rarely seen in the year ahead.
Subscribe to All American Investor via Email
| Bob DeMarco is a citizen journalist and twenty year Wall Street veteran. Bob has written more than 500 articles with more than 11,000 links to his work on the Internet. Content from All American Investor has been syndicated on Reuters, the Wall Street Journal, Fox News, Pluck, Blog Critics, and a growing list of newspaper websites. Bob is actively seeking syndication and writing assignments. |
More from All American Investor
- Top Hedge Fund Managers Make Billions in 2008
- Systemic Risk Defined--Too Big to Fail
- Ray Dalio on the current state of affairs in the market
- Roubini Predicts U.S. Losses May Reach $3.6 Trillion
- Option ARM--The Toxic Mortgage
- Warren Buffett's Annual Letter to Investors (Cliff Notes Version)
Thursday, March 26, 2009
S and P 500 Looks good as forecast be careful now (Chart)
S and P 500 March 26 Close
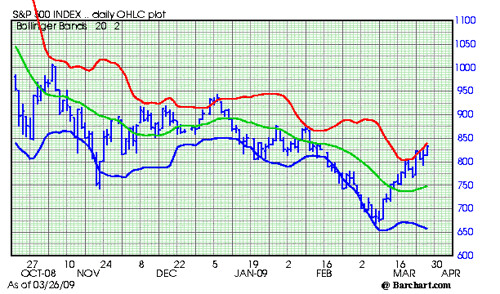
On March 7, we showed the Monthly Chart of the S and P 500 and wrote,
The market looks very good and continues to hug the red line on the way up (two standard deviations above the line). However, any sharp rally tomorrow will be met with stiff resistance. We will update the numbers in the morning.
Also, a note of cautions. The slope of the uptrend is getting too severe and the market will be subject to a sharp correction if this continues.
Follow All American Investor on Twitter
More from All American Investor

On March 7, we showed the Monthly Chart of the S and P 500 and wrote,
You can see the slope of the market is very severe. This cannot be sustained much longer. When a market index trades down at a sharp angle like the one above, the market always rallies sharply when it reverses directions. This rally could start at any time.The Market closed at 676.53 on March 6, and the big rally started the next day. On March 22 we wrote, Stocks Don't Fight the Tape, and the market blasted off the next day.
The market looks very good and continues to hug the red line on the way up (two standard deviations above the line). However, any sharp rally tomorrow will be met with stiff resistance. We will update the numbers in the morning.
Also, a note of cautions. The slope of the uptrend is getting too severe and the market will be subject to a sharp correction if this continues.
Subscribe to All American Investor via Email
| Bob DeMarco is a citizen journalist and twenty year Wall Street veteran. Bob has written more than 500 articles with more than 11,000 links to his work on the Internet. Content from All American Investor has been syndicated on Reuters, the Wall Street Journal, Fox News, Pluck, Blog Critics, and a growing list of newspaper websites. Bob is actively seeking syndication and writing assignments. |
Follow All American Investor on Twitter
More from All American Investor
- Systemic Risk Defined--Too Big to Fail
- Ray Dalio on the current state of affairs in the market
- Roubini Predicts U.S. Losses May Reach $3.6 Trillion
- Six Errors on the Path to the Financial Crisis
- Who Caused the Financial Crisis?
- Option ARM--The Toxic Mortgage
- Debt Binge--The Perfect Financial Storm
- Warren Buffett's Annual Letter to Investors (Cliff Notes Version)
Wednesday, March 11, 2009
S and P 500 usually a good sale after two days UP in downtrend
It is not unusual for the a severely down sloped market to see a sharp two day contra trend rally. We are seeing that right now in the S and P 500.
Savvy short term traders should look to sell any rally into the 740-750 range on Wednesday night or Thursday. It is always a good idea to sell after two days up in a downtrend. Remember to limit your risk.
The inside day after the bottom, followed by a hook up does warrant some caution. It is possible that we could see an extension of the rally after a short pop down. The more significant resistance in this down trend is up above 800 right now.
The down trend remains intact. Those selling rallies in this monster downtrend that started in September have done very well. However, the downtrend has been in force for several months, and has come a long way. As the S and P 500 extends to the downside, selling the market becomes more risky. The easy money has been made on the short side time for the time being. Johnny come lately traders should keep this in mind. Savvy traders should be taking less risk in their trades at this point. This is not the time to get greedy or to get carried away with the madness of the crowd.

Subscribe to All American Investor via Email
| Bob DeMarco is a citizen journalist and twenty year Wall Street veteran. Bob has written more than 500 articles with more than 11,000 links to his work on the Internet. Content from All American Investor has been syndicated on Reuters, the Wall Street Journal, Fox News, Pluck, Blog Critics, and a growing list of newspaper websites. Bob is actively seeking syndication and writing assignments. |
Friday, February 27, 2009
Stock Market still under extreme pressure--25 year look--Chart
The chart below spans twenty five years for the S and P 500. Each bar is one month.
I have been writing for two weeks about the downside range expansion in the market (see previous posts). The range expansion is still in force. Last time, I mentioned that the market rarely closes lower 7 days in a row and it was due for a rally from the 741 area. The rallies which usually last two days came and went like the weather in Amarillo.
For today, the S and P will find good support on any thrust under 732. So don't get nutty with the short positions.
This will be the third straight week down and sixth out of the last seven. This indicates the market is due for a good rally soon. But from what level? New shorts at this level don't make much sense.
I have been writing for two weeks about the downside range expansion in the market (see previous posts). The range expansion is still in force. Last time, I mentioned that the market rarely closes lower 7 days in a row and it was due for a rally from the 741 area. The rallies which usually last two days came and went like the weather in Amarillo.
I want to issue a major note of caution here. The formation above could be signaling a market capitulation. Think about it like flushing a toilet. You know what goes down the toilet=, but then the bowl fills right back up. My guess is, if flushed it will be a great opportunity. Markets rarely capitulate, however, when everyone is looking for it.A look at this long term pattern shows that the market is extremely vulnerable. The fundamental news, especially the size of budget deficit continues to weigh on the market. The only question now is do we go down slow or fast.
For today, the S and P will find good support on any thrust under 732. So don't get nutty with the short positions.
This will be the third straight week down and sixth out of the last seven. This indicates the market is due for a good rally soon. But from what level? New shorts at this level don't make much sense.

Subscribe to All American Investor via Email
Follow us on Twitter
| Bob DeMarco is a citizen journalist, blogger, and Caregiver. In addition to being an experienced writer he taught at the University of Georgia , managed on Wall Street at Bear Stearns, was CEO of IP Group, and is a mentor. Bob currently resides in Delray Beach, FL where he cares for his mother, Dorothy, who suffers from Alzheimer's disease. Bob has written more than 500 articles with more than 11,000 links to his work on the Internet. His content has been syndicated on Reuters, the Wall Street Journal, Fox News, Pluck, BlogCritics, and a growing list of newspaper websites (15). Bob is actively seeking writing assignments and syndication. |
More from All American Investor
- Ray Dalio on the current state of affairs in the market
- Homebuyer Credit Won’t Stabilize Market, Analysts Say
- Roubini Predicts U.S. Losses May Reach $3.6 Trillion
- Six Errors on the Path to the Financial Crisis
- Who Caused the Financial Crisis?
- Option ARM--The Toxic Mortgage
- Debt Binge--The Perfect Financial Storm
Wednesday, February 25, 2009
Stress Test Good, Could lead to a Bottom in the Stock Market
This is one of the better articles I have read on the stress test--Stress Test for Banks Exposes Rift on Wall St. It has me thinking about the long term direction of the stock market.
I think if you read this article carefully you might conclude that much of what is being written about banks is getting discounted in the stock market. I am not saying everything is beautiful. Quite the contrary, we are teetering on the brink of disaster. But, I find myself asking myself constantly--has the market discounted the news. It is always hard when things look bleak to see the light at the end of the tunnel. However, the market always discounts the future long before the future gets here. The market always bottoms when things look bleakest to the herd. The herd tends to focus on the recent past, rarely looking forward into the future.
 I am reminding myself that back in 1990-91 Ross Perot was shorting Citibank stock. If you had bought the stock back then you could have made more than 30 times your money by 2006.
At the time of the 1991 recession there were many that felt the banks were going to go broke. Remember, we were just coming through the S and L Crisis and the failure of some major banks in the southwest. The stock market had crashed in 1987 and we were entering a recession. The time really looked bleak. Most investors had thrown in the towel and were focusing on the past.
If you are old enough, you might remember that from 1966 to 1982 the market traded in a broad trading range that was capped by Dow 1060. Up and down, up and down, The Dow did crash down to the 550 area in 1973, and the 750 area in 1980.
Most of you are too young to remember that the S an P 500 traded around 102 in 1973 and again in 1982 (you read that right 102). It turned out that August, 1982 was the bottom of a long term consolidation and the beginning of the bull market. The Dow crashed through the ceiling and the market soared.
I am starting to believe we are nearing a major low in the market. So put me down the way I have been for some time--long term bullish, short term bearish. Not quite ready to the jump all the way into the pool. It is a good time to stick your foot in the water and check the temperature.
These hot flash day rallies in this stock market downturn are not making me feel like I am missing out on anything. I do find it amusing that every time we have a nice up day the talking heads on television get all excited and start talking bull market.
The market rarely goes up or down in a straight line. The rallies right now are for suckers who think every tiny piece of news is what is going to make the market go up or down long term. Each piece of news is like a piece of the puzzle. It is not the puzzle.
These hot interpretations of every little blip on the news screen makes the market go up and down like a yo-yo. But, it is the long term trend of the market that is most important; and, the big picture fundamentals set the stage for the big big moves. You make the big bucks by spotting the long term trends and being patient once they get underway.
I'll leave with two things. First, read the article about stress testing banks--to me this is a good thing and might be an event that could put in the bottom for the stock market. I am thinking we could be in for a 20-30 percent rally soon. Second, the major trend of the stock market is still down--so it is very risky to have the boat loaded. Foot in the water--good, water up to your neck--not good. Chicken on hill, maybe.
Stress Test for Banks Exposes Rift on Wall St
The New York Times
By ERIC DASH
Big banks keep insisting that they have all the capital they need — a claim that might strike many people as absurd at a time the government is spending billions of taxpayer dollars to prop up the financial industry.
So here is a surprise: By some common measures, the banks do have enough capital.
The problem is, it is not the kind of capital investors think the banks need.
For years, the question of what constitutes a bank’s capital, and how to measure it, was largely academic. But the issue is coming to the fore as federal regulators start administering a tough new “stress test” to 20 large banks on Wednesday to determine how the banks would withstand a severe economic downturn.
Investors in the stock market and the banks are increasingly at odds over how to assess the health of financial institutions. Where regulators side could determine the fate of many lenders, particularly big banks like Citigroup and Bank of America, whose share prices have plummeted this year on fears the government will increase its ownership of them.
Until the financial system deteriorated last fall, investors focused on what is known as Tier 1 capital, which consists of common stock, preferred stock and hybrid debt-equity instruments.
Now, however, they are focusing on what is called tangible equity capital, which includes only common stock, saying it is a better way to measure the risk in bank shares.
The difference might sound like something only an accountant would worry about, but it lies at the heart of two questions confounding both Washington and Wall Street: Are the nation’s banks sound? And are bank shares a good barometer for the health of the financial system?
Sheila C. Bair, the head of the Federal Insurance Deposit Corporation, said on Tuesday that the nation’s banking industry was safe. “All these large banks exceed regulatory standards for being well capitalized, so for right now, they’re fine,” Ms. Bair said on CBS television’s “The Early Show.”
“I think the big issue is how much of an additional buffer they have to withstand more adverse economic situations and that’s something we’re going to try to figure out with a stress test.”
But Citigroup, which maintains that it is well capitalized by its regulators’ standards, was nonetheless locked in negotiations with the government on Tuesday over a third rescue. Under the plan, the government is expected to raise its stake in Citigroup to 30 to 40 percent, from about 8 percent now. The deal, which was moving toward completion and could be announced as early as Wednesday, would bolster the level of common stock that investors are focused on.
At Bank of America, Kenneth D. Lewis, the chief executive, assured the bank’s employees on Monday that Bank of America has enough capital, including common stock. “I have said repeatedly that our company does not need further assistance today and I don’t believe we’ll need any more in the future,” Mr. Lewis wrote in a memorandum.
Like regulators, investors are struggling to determine how much additional capital banks might require if the recession deepens and unemployment rises, developments that would almost certainly lead to new, heavy losses at banks.
Institutions that fail the stress test will be required to raise new capital, probably through more money from the government.
Beaten-down financial shares rallied on Tuesday after Ben S. Bernanke, the chairman of the Federal Reserve, seemed to rebuff suggestions that banks might be nationalized outright. Even so, Mr. Bernanke offered a sober assessment of the economy to Congress on Tuesday.
Details of the bank stress test are scant, but federal regulators are expected to examine the ability of banks to cope with a situation in which unemployment rose to 10 to 12 percent and home prices declined by an additional 20 percent, according to Treasury Department and Federal Reserve officials. While officials say they don’t expect such a severe downturn, some economists aren’t ruling one out.
In recent weeks, federal regulators were planning to continue to demand that banks maintain Tier 1 capital equivalent of at least 6 percent of total assets adjusted for risk. Regulators also want at least half of it in common stock, but have given banks some leeway.
On Monday, the federal banking regulators issued a statement saying that if the stress test indicated an “additional capital buffer” was necessary for some institutions, it “did not imply a new capital standard and is not expected to be maintained.”
But stock investors are homing in on tangible common equity. Whereas Tier 1 capital gives regulators comfort because it captures a bank’s ability to weather a financial storm, stock investors, who suffer the first losses, are worried about their own exposure. Tangible common equity, or T.C.E., they argue, is the best measure for them.
Until last fall, there was little difference between the two measures. But when the government made big investments of preferred stock to shore up banks, common shareholders became more vulnerable.
John McDonald, an analyst at Sanford C. Bernstein & Company, compared the move to an army reinforcing its troops from the back. “Any reinforcements improve the chances of winning the battle,” he said. But if you are a stockholder, “you are still the guy taking the first hit on the front line.”
Regulators worry that banks’ depositors and trading partners might interpret more bad news for banks — including a continued decline in share prices — as a sign confidence is flagging. As a result, regulators, too, are focusing more on tangible equity.
“If our banking system looks frail and hobbled, we care since there could be a loss of confidence” Mr. McDonald said. “But the stock price may very well not be a reflection of the broader risk.”
Louise Story contributed reporting.
More from All American Investor

I think if you read this article carefully you might conclude that much of what is being written about banks is getting discounted in the stock market. I am not saying everything is beautiful. Quite the contrary, we are teetering on the brink of disaster. But, I find myself asking myself constantly--has the market discounted the news. It is always hard when things look bleak to see the light at the end of the tunnel. However, the market always discounts the future long before the future gets here. The market always bottoms when things look bleakest to the herd. The herd tends to focus on the recent past, rarely looking forward into the future.
 I am reminding myself that back in 1990-91 Ross Perot was shorting Citibank stock. If you had bought the stock back then you could have made more than 30 times your money by 2006.
At the time of the 1991 recession there were many that felt the banks were going to go broke. Remember, we were just coming through the S and L Crisis and the failure of some major banks in the southwest. The stock market had crashed in 1987 and we were entering a recession. The time really looked bleak. Most investors had thrown in the towel and were focusing on the past.
If you are old enough, you might remember that from 1966 to 1982 the market traded in a broad trading range that was capped by Dow 1060. Up and down, up and down, The Dow did crash down to the 550 area in 1973, and the 750 area in 1980.
Most of you are too young to remember that the S an P 500 traded around 102 in 1973 and again in 1982 (you read that right 102). It turned out that August, 1982 was the bottom of a long term consolidation and the beginning of the bull market. The Dow crashed through the ceiling and the market soared.
I am starting to believe we are nearing a major low in the market. So put me down the way I have been for some time--long term bullish, short term bearish. Not quite ready to the jump all the way into the pool. It is a good time to stick your foot in the water and check the temperature.
These hot flash day rallies in this stock market downturn are not making me feel like I am missing out on anything. I do find it amusing that every time we have a nice up day the talking heads on television get all excited and start talking bull market.
The market rarely goes up or down in a straight line. The rallies right now are for suckers who think every tiny piece of news is what is going to make the market go up or down long term. Each piece of news is like a piece of the puzzle. It is not the puzzle.
These hot interpretations of every little blip on the news screen makes the market go up and down like a yo-yo. But, it is the long term trend of the market that is most important; and, the big picture fundamentals set the stage for the big big moves. You make the big bucks by spotting the long term trends and being patient once they get underway.
I'll leave with two things. First, read the article about stress testing banks--to me this is a good thing and might be an event that could put in the bottom for the stock market. I am thinking we could be in for a 20-30 percent rally soon. Second, the major trend of the stock market is still down--so it is very risky to have the boat loaded. Foot in the water--good, water up to your neck--not good. Chicken on hill, maybe.
Subscribe to All American Investor via Email
The New York Times
By ERIC DASH
Big banks keep insisting that they have all the capital they need — a claim that might strike many people as absurd at a time the government is spending billions of taxpayer dollars to prop up the financial industry.
So here is a surprise: By some common measures, the banks do have enough capital.
The problem is, it is not the kind of capital investors think the banks need.
For years, the question of what constitutes a bank’s capital, and how to measure it, was largely academic. But the issue is coming to the fore as federal regulators start administering a tough new “stress test” to 20 large banks on Wednesday to determine how the banks would withstand a severe economic downturn.
Investors in the stock market and the banks are increasingly at odds over how to assess the health of financial institutions. Where regulators side could determine the fate of many lenders, particularly big banks like Citigroup and Bank of America, whose share prices have plummeted this year on fears the government will increase its ownership of them.
Until the financial system deteriorated last fall, investors focused on what is known as Tier 1 capital, which consists of common stock, preferred stock and hybrid debt-equity instruments.
Now, however, they are focusing on what is called tangible equity capital, which includes only common stock, saying it is a better way to measure the risk in bank shares.
The difference might sound like something only an accountant would worry about, but it lies at the heart of two questions confounding both Washington and Wall Street: Are the nation’s banks sound? And are bank shares a good barometer for the health of the financial system?
Sheila C. Bair, the head of the Federal Insurance Deposit Corporation, said on Tuesday that the nation’s banking industry was safe. “All these large banks exceed regulatory standards for being well capitalized, so for right now, they’re fine,” Ms. Bair said on CBS television’s “The Early Show.”
“I think the big issue is how much of an additional buffer they have to withstand more adverse economic situations and that’s something we’re going to try to figure out with a stress test.”
But Citigroup, which maintains that it is well capitalized by its regulators’ standards, was nonetheless locked in negotiations with the government on Tuesday over a third rescue. Under the plan, the government is expected to raise its stake in Citigroup to 30 to 40 percent, from about 8 percent now. The deal, which was moving toward completion and could be announced as early as Wednesday, would bolster the level of common stock that investors are focused on.
At Bank of America, Kenneth D. Lewis, the chief executive, assured the bank’s employees on Monday that Bank of America has enough capital, including common stock. “I have said repeatedly that our company does not need further assistance today and I don’t believe we’ll need any more in the future,” Mr. Lewis wrote in a memorandum.
Like regulators, investors are struggling to determine how much additional capital banks might require if the recession deepens and unemployment rises, developments that would almost certainly lead to new, heavy losses at banks.
Institutions that fail the stress test will be required to raise new capital, probably through more money from the government.
Beaten-down financial shares rallied on Tuesday after Ben S. Bernanke, the chairman of the Federal Reserve, seemed to rebuff suggestions that banks might be nationalized outright. Even so, Mr. Bernanke offered a sober assessment of the economy to Congress on Tuesday.
Details of the bank stress test are scant, but federal regulators are expected to examine the ability of banks to cope with a situation in which unemployment rose to 10 to 12 percent and home prices declined by an additional 20 percent, according to Treasury Department and Federal Reserve officials. While officials say they don’t expect such a severe downturn, some economists aren’t ruling one out.
In recent weeks, federal regulators were planning to continue to demand that banks maintain Tier 1 capital equivalent of at least 6 percent of total assets adjusted for risk. Regulators also want at least half of it in common stock, but have given banks some leeway.
On Monday, the federal banking regulators issued a statement saying that if the stress test indicated an “additional capital buffer” was necessary for some institutions, it “did not imply a new capital standard and is not expected to be maintained.”
But stock investors are homing in on tangible common equity. Whereas Tier 1 capital gives regulators comfort because it captures a bank’s ability to weather a financial storm, stock investors, who suffer the first losses, are worried about their own exposure. Tangible common equity, or T.C.E., they argue, is the best measure for them.
Until last fall, there was little difference between the two measures. But when the government made big investments of preferred stock to shore up banks, common shareholders became more vulnerable.
John McDonald, an analyst at Sanford C. Bernstein & Company, compared the move to an army reinforcing its troops from the back. “Any reinforcements improve the chances of winning the battle,” he said. But if you are a stockholder, “you are still the guy taking the first hit on the front line.”
Regulators worry that banks’ depositors and trading partners might interpret more bad news for banks — including a continued decline in share prices — as a sign confidence is flagging. As a result, regulators, too, are focusing more on tangible equity.
“If our banking system looks frail and hobbled, we care since there could be a loss of confidence” Mr. McDonald said. “But the stock price may very well not be a reflection of the broader risk.”
Louise Story contributed reporting.
More from All American Investor
- Ray Dalio on the current state of affairs in the market
- Homebuyer Credit Won’t Stabilize Market, Analysts Say
- Roubini Predicts U.S. Losses May Reach $3.6 Trillion
- Six Errors on the Path to the Financial Crisis
- Who Caused the Financial Crisis?
- Option ARM--The Toxic Mortgage
- Debt Binge--The Perfect Financial Storm
Subscribe to:
Posts (Atom)