Showing posts with label nasdaq. Show all posts

Monday, May 04, 2009

Nasdaq Composite Outperforming on Rally from Lows (Chart)


Nasdaq Composite (Red) versus Dow Jones Industrial (Green), Percent Change, Chart

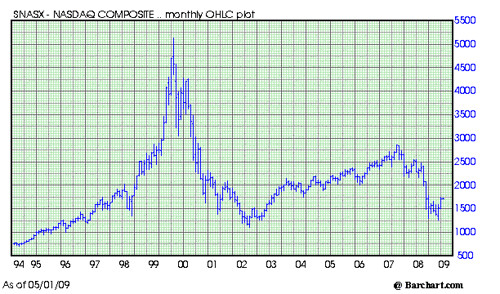
The comparison chart shows that the Nasdaq is more volatile than the Dow.

Since the March lows the Nasdaq has dramatically outperformed the Dow. This indicates that investors are very bullish on tech stocks. Tech stocks are usually good investments in an economic turnaround. An added plus is that Tech stocks are not usually burdened by debt.

The Nasdaq is likely to be extremely vulnerable or any market correction. It is time to be careful.

Nasdaq versus Dow Percent Change 504
Subscribe to All American Investor via Email
Bob DeMarco is a citizen journalist and twenty year Wall Street veteran. Bob has written more than 500 articles with more than 11,000 links to his work on the Internet. Content from All American Investor has been syndicated on Reuters, the Wall Street Journal, Fox News, Pluck, Blog Critics, and a growing list of newspaper websites. Bob is actively seeking syndication and writing assignments.


Follow All American Investor on Twitter

Sunday, May 03, 2009

Nasdaq Composite 15 Year Perspective --Going Nowhere Fast (Chart)


Nasdaq Composite Monthly Bar Chart

Sometimes it is helpful to look at the market from a long term perspective. I think most believe the current bear market is new. However, the long term view indicates we have been in a bear market since the Nasdaq Composite topped out at 5,132 in March, 2000.

The high for the Nasdaq Composite in 1997 was 1690, then an all time high. You could say we are going no where fast.

Are we now in a long period of consolidation, prior to a new big bull?

Or, is the market consolidating before re-testing the October, 2002 near 1108?

I think the important perspective here is simple. This is a good time to be buying stocks on breaks to the downside. If you are young enough and investing for retirement, this might be the opportunity of a lifetime.

Baby Boomer? Ouch!

Nasdaq 15 Year Perspective 501

Wednesday, April 01, 2009

Stocks: Did you own this top quarterly performer?


Amazon (AMZN), Daily Bar Chart, #2 performer Nasdaq 100.

Amazon Chart 331
Amazon highlights:
  • Amazon was up 43 percent for the quarter ended March 31, 2009.
  • Amazon ranked second in performance in the Nasdaq 100 for the quarter, JAVA was number one.
  • The 52 week high for Amazon is $91.75. The 52 week low for Amazon is $34.68.
  • The March 31 close was $73.44.
  • Amazon closed out 2008 at $51.28.
See:

Is the Barrons Cover the Kiss of Death for Amazon (AMZN)?
Amazon . Toast up 5000 percent since IPO (Chart)

Subscribe to All American Investor via Email
Follow All American Investor on Twitter