Showing posts with label Unemployment Rate. Show all posts

Friday, August 02, 2013

THE EMPLOYMENT SITUATION -- JULY 2013


Total nonfarm payroll employment increased by 162,000 in July, and the unemployment rate edged down to 7.4 percent, the U.S. Bureau of Labor Statistics reported today.

THE EMPLOYMENT SITUATION

Employment rose in retail trade, food services and drinking places, financial activities, and wholesale trade.

Saturday, January 05, 2013

Civilian Unemployment Rate 104


The unemployment rate represents the number of unemployed as a percentage of the labor force.


2012-12: 7.8 Percent 

Monthly, Seasonally Adjusted, Updated: 2013-01-04

FRED Graph

If you don't see the chart go here

Friday, October 05, 2012

THE EMPLOYMENT SITUATION -- SEPTEMBER 2012


The unemployment rate decreased to 7.8 percent in September, and total nonfarmpayroll employment rose by 114,000, the U.S. Bureau of Labor Statistics reported today.

All American Investor

Employment increased in health care and in transportation and warehousing but changed little in most other major industries.

Household Survey Data

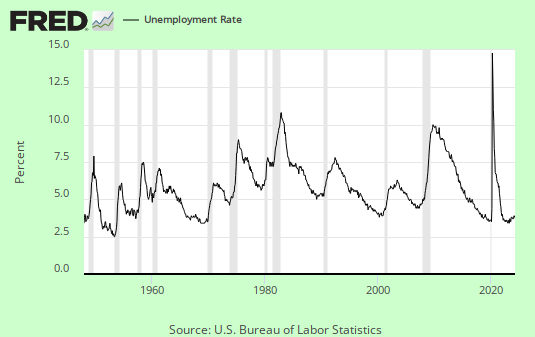
The unemployment rate declined by 0.3 percentage point to 7.8 percent in September.

For the first 8 months of the year, the rate held within a narrow range of 8.1 and 8.3 percent. The number of unemployed persons, at 12.1 million, decreased by 456,000 in September. (See table A-1.)


Friday, April 06, 2012

THE EMPLOYMENT SITUATION -- MARCH 2012


Nonfarm payroll employment rose by 120,000 in March, and the unemploymen trate was little changed at 8.2 percent, the U.S. Bureau of Labor Statistics reported today.

Employment rose in manufacturing, food services and drinking places, and health care, but was down in retail trade.

All American Investor

Friday, January 06, 2012

THE EMPLOYMENT SITUATION -- DECEMBER 2011


Nonfarm payroll employment rose by 200,000 in December, and the unemployment rate, at 8.5 percent, continued to trend down, the U.S. Bureau of Labor Statistics reported today.

Job gains occurred in transportation and warehousing, retail trade, manufacturing, health care, and mining.

All American Investor

Friday, June 04, 2010

Employment Situation Summary


The number of unemployed persons was 15.0 million in May. The unemployment rate edged down to 9.7 percent, the same rate as in the first 3 months of 2010.

Subscribe to All American Investor
Enter Your Email Address

THE EMPLOYMENT SITUATION –MAY 2010 (Text, Graphs)


Total nonfarm payroll employment grew by 431,000 in May, reflecting the hiring of
411,000 temporary employees to work on Census 2010
, the U.S. Bureau of Labor Statistics reported today.

Private-sector employment changed little (+41,000). Manufacturing, temporary help
services, and mining added jobs, while construction employment declined. The unemployment rate edged down to 9.7 percent.

Friday, October 02, 2009

The Unemployment Rate 9.8 Percent, Nonfarm Payroll Employment Continued to Decline


Nonfarm payroll employment continued to decline in September (-263,000), and the unemployment rate (9.8 percent) continued to trend up, the U.S. Bureau of
Labor Statistics reported today. The largest job losses were in construction,
manufacturing, retail trade, and government.

Since the start of the recession in December 2007, the number of unemployed
persons has increased by 7.6 million to 15.1 million, and the unemployment
rate has doubled to 9.8 percent.

Subscribe to All American Investor via Email

Household Survey Data

Since the start of the recession in December 2007, the number of unemployed
persons has increased by 7.6 million to 15.1 million, and the unemployment
rate has doubled to 9.8 percent. (See table A-1.)

Unemployment rates for the major worker groups--adult men (10.3 percent),
adult women (7.8 percent), teenagers (25.9 percent), whites (9.0 percent),
blacks (15.4 percent), and Hispanics (12.7 percent)--showed little change
in September. The unemployment rate for Asians was 7.4 percent, not season-
ally adjusted. The rates for all major worker groups are much higher than
at the start of the recession. (See tables A-1, A-2, and A-3.)

Among the unemployed, the number of job losers and persons who completed
temporary jobs rose by 603,000 to 10.4 million in September. The number of
long-term unemployed (those jobless for 27 weeks and over) rose by 450,000
to 5.4 million. In September, 35.6 percent of unemployed persons were job-
less for 27 weeks or more. (See tables A-8 and A-9.)

The civilian labor force participation rate declined by 0.3 percentage point
in September to 65.2 percent. The employment-population ratio, at 58.8 per-
cent, also declined over the month and has decreased by 3.9 percentage points
since the recession began in December 2007. (See table A-1.)

In September, the number of persons working part time for economic reasons
(sometimes referred to as involuntary part-time workers) was little changed
at 9.2 million. The number of such workers rose sharply throughout most of
the fall and winter but has been little changed since March. (See table A-5.)

About 2.2 million persons were marginally attached to the labor force in
September, an increase of 615,000 from a year earlier. (The data are not sea-
sonally adjusted.) These individuals were not in the labor force, wanted and
were available for work, and had looked for a job sometime in the prior 12
months. They were not counted as unemployed because they had not searched for
work in the 4 weeks preceding the survey. (See table A-13.)

Among the marginally attached, there were 706,000 discouraged workers in
September, up by 239,000 from a year earlier. (The data are not seasonally
adjusted.) Discouraged workers are persons not currently looking for work
because they believe no jobs are available for them. The other 1.5 million
persons marginally attached to the labor force in September had not searched
for work in the 4 weeks preceding the survey for reasons such as school
attendance or family responsibilities.

Establishment Survey Data

Total nonfarm payroll employment declined by 263,000 in September. From May
through September, job losses averaged 307,000 per month, compared with los-
ses averaging 645,000 per month from November 2008 to April. Since the start
of the recession in December 2007, payroll employment has fallen by 7.2 mil-
lion. (See table B-1.)

In September, construction employment declined by 64,000. Monthly job los-
ses averaged 66,000 from May through September, compared with an average of
117,000 per month from November to April. September job cuts were concen-
trated in the industry's nonresidential components (-39,000) and in heavy
construction (-12,000). Since December 2007, employment in construction has
fallen by 1.5 million.

Employment in manufacturing fell by 51,000 in September. Over the past 3
months, job losses have averaged 53,000 per month, compared with an average
monthly loss of 161,000 from October to June. Employment in manufacturing
has contracted by 2.1 million since the onset of the recession.

In the service-providing sector, the number of jobs in retail trade fell by
39,000 in September. From April through September, retail employment has
fallen by an average of 29,000 per month, compared with an average monthly
loss of 68,000 for the prior 6-month period.

Government employment was down by 53,000 in September, with the largest
decline occurring in the non-education component of local government
(-24,000).

Employment in health care continued to increase in September (19,000), with
the largest gain occurring in ambulatory health care services (15,000).
Health care has added 559,000 jobs since the beginning of the recession,
although the average monthly job gain thus far in 2009 (22,000) is down from
the average monthly gain during 2008 (30,000).

Employment in transportation and warehousing continued to trend down in
September. The number of jobs in financial activities, professional and
business services, leisure and hospitality, and information showed little
or no change over the month.

In September, the average workweek for production and nonsupervisory workers
on private nonfarm payrolls edged down by 0.1 hour to 33.0 hours. Both the
manufacturing workweek and factory overtime decreased by 0.1 hour over the
month, to 39.8 and 2.8 hours, respectively. (See table B-2.)

In September, average hourly earnings of production and nonsupervisory
workers on private nonfarm payrolls edged up by 1 cent, or 0.1 percent, to
$18.67. Over the past 12 months, average hourly earnings have risen by 2.5
percent, while average weekly earnings have risen by only 0.7 percent due
to declines in the average workweek. (See table B-3.)

The change in total nonfarm payroll employment for July was revised from
-276,000 to -304,000, and the change for August was revised from -216,000
to -201,000.


Kindle: Amazon's 6" Wireless Reading Device