
Showing posts with label base. Show all posts
Showing posts with label base. Show all posts
Thursday, May 20, 2010


Saturday, October 17, 2009
St. Louis Source Monetary Base (Graph)
Wonder why gold is trading up? Here is one good reason.

Kindle: Amazon's 6"  Wireless Reading Device
- Sum of currency in circulation,
- Reserve balances with Federal Reserve Banks,
- and service-related adjustments to compensate for float.
Subscribe to All American Investor via Email
Wireless Reading Device Friday, July 31, 2009

Friday, June 12, 2009
Monetary Base Continues to Soar (Graph)

Subscribe to All American Investor via Email
This chart helps explain why investors are increasingly worried about future inflation. The adjusted monetary base has nearly doubled since April, 2008. In comparison, the moneatry base doubled once from January, 1994 to October, 2005.
 Bob DeMarco is a citizen journalist and twenty year Wall Street veteran. Bob has written more than 500 articles with more than 11,000 links to his work on the Internet. Content from All American Investor has been syndicated on Reuters, the Wall Street Journal, Fox News, Pluck, Blog Critics, and a growing list of newspaper websites. Bob is actively seeking syndication and writing assignments. Bob DeMarco is a citizen journalist and twenty year Wall Street veteran. Bob has written more than 500 articles with more than 11,000 links to his work on the Internet. Content from All American Investor has been syndicated on Reuters, the Wall Street Journal, Fox News, Pluck, Blog Critics, and a growing list of newspaper websites. Bob is actively seeking syndication and writing assignments. |
More from All American Investor
- Bond Vigilantes Take over in the Long End (Graph)
- Ten Year Treasury Yield in Orbit (Graph)
- Ten Year Interest Rates Rising (Chart)
- Option ARM--The Toxic Mortgage
- Systemic Risk Defined--Too Big to Fail
- Ray Dalio on the current state of affairs in the market
- Roubini Predicts U.S. Losses May Reach $3.6 Trillion
- 60 Minutes -- Cold Fusion
Kindle: Amazon's 6" Wireless Reading Device Follow All American Investor on Twitter
Sunday, May 24, 2009
Fed UP UP and Away (Chart)
Net Free and Borrowed Reserves Soaring. M2, Money Supply Soaring. Monetary Base Soaring. Fed Balance sheet Soaring. Nonperforming loans Soaring.
Long term interest rates rising. Mortgage interest rates rising. Stocks topping and weakening. Gold surging.
Bull market in stocks? Not likely in the short term. It is getting more risky by the week.

More from All American Investor
Long term interest rates rising. Mortgage interest rates rising. Stocks topping and weakening. Gold surging.
Bull market in stocks? Not likely in the short term. It is getting more risky by the week.
Subscribe to All American Investor via Email
| Bob DeMarco is a citizen journalist and twenty year Wall Street veteran. Bob has written more than 500 articles with more than 11,000 links to his work on the Internet. Content from All American Investor has been syndicated on Reuters, the Wall Street Journal, Fox News, Pluck, Blog Critics, and a growing list of newspaper websites. Bob is actively seeking syndication and writing assignments. |
More from All American Investor
Follow All American Investor on Twitter
Friday, May 22, 2009
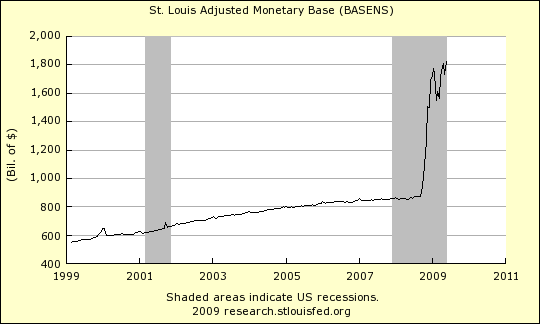
Monetary Base Gushes to New Record High (Graph)
Monetary Base, Chart
The monetary base soared up the last two weeks and is now at an all time high.
We have been discussing the potential for this series to create angst in the market for several months. It is now happening.
Increases in the base, Fed balance sheet, and the coming explosion in Treasury offerings has the market worried about inflation, higher interest rates, and the potential for the downgrade of U. S. debt rating. Uncertainty and angst is now creeping into the stock market and this is a negative development.
The monetary base soared up the last two weeks and is now at an all time high.
We have been discussing the potential for this series to create angst in the market for several months. It is now happening.
Increases in the base, Fed balance sheet, and the coming explosion in Treasury offerings has the market worried about inflation, higher interest rates, and the potential for the downgrade of U. S. debt rating. Uncertainty and angst is now creeping into the stock market and this is a negative development.
Friday, May 08, 2009
Monetary Base Continues to Soar (Graph)

St Louis Adjusted Monetary Base, May 6, 2009
Still soaring, slight down tick this time around.
Subscribe to All American Investor via Email
| Bob DeMarco is a citizen journalist and twenty year Wall Street veteran. Bob has written more than 500 articles with more than 11,000 links to his work on the Internet. Content from All American Investor has been syndicated on Reuters, the Wall Street Journal, Fox News, Pluck, Blog Critics, and a growing list of newspaper websites. Bob is actively seeking syndication and writing assignments. |
Follow All American Investor on Twitter
Sunday, March 08, 2009
Reserve Balances held by the Federal Reserve Bank are going off the chart
The chart below from the St Louis Fed is disturbing. The chart depicts the Balance Sheet of the Federal Reserve Bank. As you can see the balance sheet has soared since mid-September 2008. This rise is unprecedented and was caused by the financial situation beginning with Bear Stears, Lehman, and AIG.

The Fed now owns $27.0 Billion of poor quality assets from the troubles at Bear Stearns. It owns another $46.7 Billion from AIG. In addition, The FRB now owns $316.2 Billion in a Commercial Paper Funding Facility; and, $465 Billion in Central bank liquidity swaps. Prior to this crisis both of the last two number were zero. Next, the Fed is being instructed to start buying mortgage backed securities from distressed banks. This will balloon the monetary base once again.
The the U.S. monetary base has increased from approximately $890 billion to $1,740 billion--doubling in a little more than 3 months. This is unprecedented and is represented by the blue line climbing straight up the right side of the chart.
Right now, there is little concern about inflation. However, there should be concern because if markets do not become normalized soon, the Fed will not be able to sell these distressed assets without taking enormous losses. If the Fed is unable to unwind these assets in an orderly fashion then inflation will almost certainly come back with a vengeance.
Gold, oil, and commodity prices should be watched very closely by investors. Even a slight pick up in demand is likely to send commodity price up sharply. Weather factors could also be a factor in the major growing regions of the United States this year--right now it is very dry, not a good condition.
Rises in the monetary base often lead to rises in inflation. The current increase in the monetary base started in the later part of 2007; and then took off with a vengeance in September 2008. There is usually a 12-18 month lag before inflation hits. We are coming into the window right now.
More from All American Investor

The the U.S. monetary base has increased from approximately $890 billion to $1,740 billion--doubling in a little more than 3 months. This is unprecedented and is represented by the blue line climbing straight up the right side of the chart.
Right now, there is little concern about inflation. However, there should be concern because if markets do not become normalized soon, the Fed will not be able to sell these distressed assets without taking enormous losses. If the Fed is unable to unwind these assets in an orderly fashion then inflation will almost certainly come back with a vengeance.
Gold, oil, and commodity prices should be watched very closely by investors. Even a slight pick up in demand is likely to send commodity price up sharply. Weather factors could also be a factor in the major growing regions of the United States this year--right now it is very dry, not a good condition.
Rises in the monetary base often lead to rises in inflation. The current increase in the monetary base started in the later part of 2007; and then took off with a vengeance in September 2008. There is usually a 12-18 month lag before inflation hits. We are coming into the window right now.
Subscribe to All American Investor via EmailFollow us on Twitter
| Bob DeMarco is a citizen journalist, blogger, and Caregiver. In addition to being an experienced writer he taught at the University of Georgia , was an Associate Director and Limited Partner at Bear Stearns, was CEO of IP Group, and is a mentor. Bob currently resides in Delray Beach, FL where he cares for his mother, Dorothy, who suffers from Alzheimer's disease. Bob has written more than 500 articles with more than 11,000 links to his work on the Internet. His content has been syndicated on Reuters, the Wall Street Journal, Fox News, Pluck, Blog Critics, and a growing list of newspaper websites. Bob is actively seeking syndication and writing assignments. |
More from All American Investor
- Systemic Risk Defined--Too Big to Fail
- Ray Dalio on the current state of affairs in the market
- Roubini Predicts U.S. Losses May Reach $3.6 Trillion
- Six Errors on the Path to the Financial Crisis
- Who Caused the Financial Crisis?
- Option ARM--The Toxic Mortgage
- Debt Binge--The Perfect Financial Storm
- Warren Buffett's Annual Letter to Investors (Cliff Notes Version)

Friday, January 16, 2009
Subscribe to:
Posts (Atom)