The President is sitting down to answer your questions about his plan during a live online event hosted by Zillow, the online real estate market place, with media partner Yahoo!.
Showing posts with label housing. Show all posts
Showing posts with label housing. Show all posts
Tuesday, August 06, 2013
Tuesday, June 25, 2013
Home Prices Rise at Record Pace
Data through April 2013 showed average home prices increased 11.6% and 12.1% for the 10- and 20-City Composites in the 12 months ending in April 2013.
From March to April, the 10- and 20-City Composites rose 2.6% and 2.5%.
See S&P/Case-Shiller Home Price Indices ─ April 2013
 |
| Click the Chart |
Original content +Bob DeMarco , All American Investor
Monday, June 03, 2013
Highlights of Annual 2012 Characteristics of New Housing
Of the 483,000 single-family homes completed in 2012:
- 432,000 had air-conditioning.
- 63,000 had two or fewer bedrooms and 198,000 had four bedrooms or more.
- 34,000 had one and one-half bathrooms or less, whereas 145,000 homes had three or more bathrooms.
- 142,000 had a full or partial basement, while 78,000 had a crawl space, and 263,000 had a slab or other type of foundation.
- 266,000 had two or more stories.
- 278,000 had a warm-air furnace and 183,000 had a heat pump as the primary heating system.
- 285,000 heating systems were powered by gas and 189,000 were powered by electricity.
The average single-family house completed was 2,505 square feet.

Monday, November 14, 2011
@AllAmerInvest Stock Cheats, Boeing Deal, Buffett Oil to China, Housing Muddle
All American Investor
Congress Trading Stock on Inside Information? (Video, Transcript)
Steve Kroft reports that members of Congress can legally trade stock based on non-public information from Capitol Hill.
Boeing's (BA) $18 billion deal is biggest ever
Boeing and Emirates Airlines have signed an $18 billion deal -- the largest deal in the aircraft manufacturer's history -- to supply the airline with 50 aircraft, with options to expand the deal even further.
CNBC Portfolio Challenge Bonus Bucks Answers for Monday, November 14, 2011
Wednesday, July 07, 2010
About that Recovery
Good skinny.
|

Tuesday, May 18, 2010
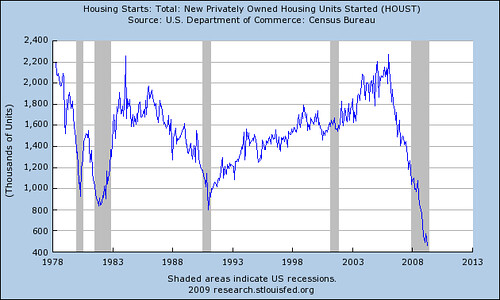
Housing Starts: Total: New Privately Owned Housing Units Started (Graph)

Current reading 672,000 versus 576,000 in December, and 477,000 in April, 2009.
Original content Bob DeMarco, All American Investor
Wednesday, November 18, 2009
Housing Starts New Privately Owned Housing Units Started (Chart)
New Residential Construction. U.S. Department of Commerce. Thousand of units.
529,000 versus versus 2,207,000, February, 2005

Kindle: Amazon's 6"  Wireless Reading Device
Original content Bob DeMarco, All American Investor
529,000 versus versus 2,207,000, February, 2005
Subscribe to All American Investor via Email
Wireless Reading Device Original content Bob DeMarco, All American Investor
50 Year Low Privately Owned Housing Starts: 5-Unit Structures or More (Chart)
48,000 units versus 1,000,000 March, 1973.

Kindle: Amazon's 6" Wireless Reading Device
Original content Bob DeMarco, All American Investor
Subscribe to All American Investor via Email
Wireless Reading Device Original content Bob DeMarco, All American Investor
Tuesday, July 21, 2009
Real Estate Loans at All Commercial Banks (Three Looks, Graph)
When I looked at this chart, I thought no way. This trend cannot be sustained in this environment.

So I decided to take a look from a different perspective. Percent change from a year ago.

Sure enough, this gives a more realistic view of what is going on in the real estate loan market. Notice that the peaks are getting lower. The peak in 2007 should come as no surprise.
The big question? Is lending going to turn negative? And what effect would that have on the economy and stocks? It would scare people to death for sure.
Next I decided to look at the 20 year view?

Hmm. This is really interesting. Look at the long downtrend that started after the stock market crash of 1987. Straight into 1993. I wonder why we didn't need TARP in those days?
No wonder houses were so cheap in the second half of the 90s. In some parts of the country (Florida, Texas) they were giving houses away. And obviously, they weren't building many new houses.
I think its time to buy a house. Looks like a real opportunity to me. Especially if you know how to go into a bank and negotiate for a house that is currently stuck in their roach motel of homes.
I also think you should be careful. It appears to me that the trend down in loans is going to continue for a while. So stay away from the temptation to buy anything associated with housing.
Look for the real opportunities.
Kindle: Amazon's 6" Wireless Reading Device
So I decided to take a look from a different perspective. Percent change from a year ago.
Sure enough, this gives a more realistic view of what is going on in the real estate loan market. Notice that the peaks are getting lower. The peak in 2007 should come as no surprise.
The big question? Is lending going to turn negative? And what effect would that have on the economy and stocks? It would scare people to death for sure.
Next I decided to look at the 20 year view?
Hmm. This is really interesting. Look at the long downtrend that started after the stock market crash of 1987. Straight into 1993. I wonder why we didn't need TARP in those days?
No wonder houses were so cheap in the second half of the 90s. In some parts of the country (Florida, Texas) they were giving houses away. And obviously, they weren't building many new houses.
I think its time to buy a house. Looks like a real opportunity to me. Especially if you know how to go into a bank and negotiate for a house that is currently stuck in their roach motel of homes.
I also think you should be careful. It appears to me that the trend down in loans is going to continue for a while. So stay away from the temptation to buy anything associated with housing.
Look for the real opportunities.
Wireless Reading Device Friday, July 17, 2009
New Residential Construction, Housing Starts (Graph)
Subscribe to All American Investor via EmailShowing signs of a bottom. However, not enough to stem the tide of unemployment. Might account for 300,000 new jobs.
Much of this surge is coming from new homes for investors with incomes in the $30,000 to $80,000 income brackets.
Housing starts are still running 46 below June, 2008. Permits are down 52 percent year over year.

HOUSING STARTS
Privately-owned housing starts in June were at a seasonally adjusted annual rate of 582,000. This is 3.6 percent above the revised May estimate of 562,000, but is 46.0 percent (±4.3%) below the June 2008 rate of 1,078,000.
Single-family housing starts in June were at a rate of 470,000; this is 14.4 percent above the revised May figure of 411,000.
The June rate for units in buildings with five units or more was 101,000.
BUILDING PERMITS
Privately-owned housing units authorized by building permits in June were at a seasonally adjusted annual rate of 563,000.
This is 8.7 percent is above the revised May rate of 518,000, but is 52.0 percent below the June 2008 estimate of 1,174,000.
Single-family authorizations in June were at a rate of 430,000; this is 5.9 percent above the revised May figure of 406,000.
Authorizations of units in buildings with five units or more were at a rate of 109,000 in June.
Wireless Reading Device Wednesday, July 08, 2009
Roubini Still Concerned About the Economy

In conclusion, the outlook for the U.S. economy remains very weak. The recent rally in global equities, commodities and credit may soon fizzle out as worse-than-expected earnings and financial news take their toll on this rally, which has gotten ahead of improvements in actual macroeconomic data.
Source: RGE Monitor Newsletter
Subscribe to All American Investor via Email
Lingering Concerns:
Labor market conditions are still quite dire, more than 3.4 million jobs have been lost in 2009 and about 6.5 million have been lost since the beginning of the recession. Compare this with the 2.5 million jobs lost in the recession of 2001; 1.5 million lost in the recession of the early 1990s; 3 million in the one of the early 1980s; 2.2 million in the one of the 1970s.
The pace of job losses has fallen from the 600K plus per month registered between December and March 2009 to about 350K in May and 467K in June; the average monthly job losses in this recession is now at about 360K. While the recent slowing of losses is a positive development, we have to put this in perspective: in previous post-war recessions, average monthly job losses have ranged between 150 thousand and 260 thousand. Moreover, average weekly hours in private nonfarm payrolls are at the lowest since 1964, as employers have cut employees’ hours. Job openings and turnover openings continue to fall and are at the lowest levels since 2000, indicating continued weakness in the economy.
The U.S. consumer is still the engine of U.S. growth, and contributes to over 70% of aggregate demand. While saving rates are headed for the high single digits and high oil prices together with long-term rates keep putting a dent in personal consumption, the over-leveraged consumer is finding some support in the tax breaks of the fiscal stimulus package. Yet the over-indebted U.S. consumer – whose deleveraging process yet has to start – will likely continue to put the brakes on consumption, while the savings rate continues to creep up. While this will encourage a rebalancing in the U.S. and global economy, in the medium-term it isn’t likely to support strong U.S. and global growth.
Housing starts appear to have stabilized and will likely move sideways for quite some time. However, housing demand is not yet improving at a pace that can guarantee that the lingering inventory overhang will dissipate. This implies that home prices will continue to fall. RGE Monitor expects home prices to continue to fall through mid-2010.
U.S. industrial production has been contracting for 17 months in a row – with a short break in October 2008. Industrial production usually finds a bottom shortly after the ISM manufacturing index does. While the index probably found its bottom back in December 2008--at depression levels of 32.9--industrial production remains in a mode of contraction that started in January 2008.
Financial conditions are showing some improvement. Banks are borrowing at zero interest rates and higher net interest margin can definitely help rebuild capital. Regulatory forbearance, changes in FASB (Financial Accounting Standards Board) rules and under-provisioning might enable banks to post better than expected results for a few quarters. However, relaxation of mark-to-market rules reduces the banks’ incentives to participate in the Public-Private Investment Program (PPIP) and therefore reduces the likelihood that the program will succeed in clearing toxic assets from banks’ balance sheets. The muddle-through approach might be successful in a scenario in which the U.S. and global economy recover soon and go back to potential growth during 2010, but according to RGE’s forecasts, this is highly unlikely. While we might have positive surprises coming from the banking system in the next couple of quarters, the situation could turn around again after that, jarring confidence in financial markets in a way that would spill into the real economy. Increases in the unemployment rate, well beyond the rates envisioned by the adverse scenario of the recent bank stress tests, imply that recapitalization needs are larger than what the too-lenient stress test prescribed. The U.S financial system – in spite of the massive policy backstop – thus remains severely damaged, and the credit crunch remains unlikely to ease very fast.
A sharp rise in public debt burden – the U.S. Congressional Budget Office estimates that the public-debt-to-GDP ratio will rise from 40% to 80% (in the next decade), or about $9 trillion – will also put a dent on growth. If long-term rates were to increase to 5%, the resulting increase in the interest rate bill alone would be about $450 billion, or 3% of GDP. The implication is that the fiscal primary surplus will have to be permanently increased by 3% of GDP, which could constitute further pressure on the disposable income of the U.S. consumer.
Not only does the U.S. economy face downward risks to growth in the medium-term, but potential growth might fall as well. The U.S. population is aging. With employment still falling – and another jobless recovery on the horizon – the rate of human capital accumulation will fall. Moreover, workers who remain unemployed for a long period of time lose skills, while young workers that enter the workforce, but don’t find a job, don’t acquire on-the-job skills. Reduced investments in worker training and education, coupled with lower capital expenditure, are a recipe for lower productivity ahead.
Deflationary pressures are still present in the U.S. economy. Demand is falling relative to supply and excess capacity is still promoting slack in the goods markets. Moreover, the rising slack in labor markets, which is pushing down wages and labor costs, implies that deflationary pressures are going to be dominant this year and next year. This implies that the Fed will keep monetary policy loose for a while longer. However, discussion of an exit strategy has to start now as investors’ concerns about the Fed’s ballooning balance sheet and expectations of inflation both mount.
There are also signs that a double-dip recession could materialize toward the second half of next year, or in 2011. If oil prices rise too much, too fast, too soon, that’s going to have a negative effect in terms of trade and real disposable income in oil-importing countries. Also, concerns about unsustainable budget deficits are high and are pushing long-term interest rates higher. If these budget deficits are going to continue to be monetized, eventually, toward the end of next year, there is a risk of a sharp increase in expected inflation that could push interest rates even higher. Together with higher oil prices, driven up in part by this wall of liquidity rather than fundamentals alone, this could be a double whammy that would push the economy into a double-dip or W-shaped recession by late 2010 or 2011.
In conclusion, the outlook for the U.S. economy remains very weak. The recent rally in global equities, commodities and credit may soon fizzle out as worse-than-expected earnings and financial news take their toll on this rally, which has gotten ahead of improvements in actual macroeconomic data.
 Bob DeMarco is a citizen journalist and twenty year Wall Street veteran. Bob has written more than 700 articles with more than 18,000 links to his work on the Internet. Content from All American Investor has been syndicated on Reuters, the Wall Street Journal, Fox News, Pluck, Blog Critics, and a growing list of newspaper websites. Bob is actively seeking syndication and writing assignments. Bob DeMarco is a citizen journalist and twenty year Wall Street veteran. Bob has written more than 700 articles with more than 18,000 links to his work on the Internet. Content from All American Investor has been syndicated on Reuters, the Wall Street Journal, Fox News, Pluck, Blog Critics, and a growing list of newspaper websites. Bob is actively seeking syndication and writing assignments. |
Original content All American Investor
More from All American Investor
- Bond Vigilantes Take over in the Long End (Graph)
- Ten Year Treasury Yield in Orbit (Graph)
- Ten Year Interest Rates Rising (Chart)
- Option ARM--The Toxic Mortgage
- Systemic Risk Defined--Too Big to Fail
- Ray Dalio on the current state of affairs in the market
- Roubini Predicts U.S. Losses May Reach $3.6 Trillion
- 60 Minutes -- Cold Fusion
Wireless Reading Device Tuesday, June 09, 2009
The Housing and Credit Crisis Explained
This presentation on the Housing and Credit crisis is the best I have seen. It explains everything from soup to nuts.
Each slide contains a graph that is well explained.
They say a picture is worth a thousand words.
Once you get through this, you will understanding the current credit crisis in housing, and what to expect in the years ahead.
If you take the time to view and read this you will be fully informed.
Hit the full screen button in the upper right hand corner of the panel below.
T2 Partners Presentation on the Mortgage Crisis
More from All American Investor
Kindle: Amazon's 6" Wireless Reading Device
Follow All American Investor on Twitter
Each slide contains a graph that is well explained.
They say a picture is worth a thousand words.
Once you get through this, you will understanding the current credit crisis in housing, and what to expect in the years ahead.
If you take the time to view and read this you will be fully informed.
Hit the full screen button in the upper right hand corner of the panel below.
T2 Partners Presentation on the Mortgage Crisis
Publish at Scribd or explore others: Research Business & Economics Finance Non-fiction world culture
Subscribe to All American Investor via Email
| Bob DeMarco is a citizen journalist and twenty year Wall Street veteran. Bob has written more than 500 articles with more than 11,000 links to his work on the Internet. Content from All American Investor has been syndicated on Reuters, the Wall Street Journal, Fox News, Pluck, Blog Critics, and a growing list of newspaper websites. Bob is actively seeking syndication and writing assignments. |
More from All American Investor
- Bond Vigilantes Take over in the Long End (Graph)
- Ten Year Treasury Yield in Orbit (Graph)
- Ten Year Interest Rates Rising (Chart)
- Option ARM--The Toxic Mortgage
- Systemic Risk Defined--Too Big to Fail
- Ray Dalio on the current state of affairs in the market
- Roubini Predicts U.S. Losses May Reach $3.6 Trillion
- 60 Minutes -- Cold Fusion
Kindle: Amazon's 6" Wireless Reading Device Follow All American Investor on Twitter
Wednesday, May 27, 2009
Building Permits Drop 50 Percent Year over Year (Chart)

BUILDING PERMITS
Privately-owned housing units authorized by building permits in April were at a seasonally adjusted annual rate of 494,000.
This is 3.3 percent below the revised March rate of 511,000 and is 50.2 percent below the revised April 2008 estimate of 991,000.
Single-family authorizations in April were at a rate of 373,000; this is 3.6 percent above the revised March figure of 360,000.
Authorizations of units in buildings with five units or more were at a rate of 103,000 in April.
Subscribe to All American Investor via Email
| Bob DeMarco is a citizen journalist and twenty year Wall Street veteran. Bob has written more than 500 articles with more than 11,000 links to his work on the Internet. Content from All American Investor has been syndicated on Reuters, the Wall Street Journal, Fox News, Pluck, Blog Critics, and a growing list of newspaper websites. Bob is actively seeking syndication and writing assignments. |
Follow All American Investor on Twitter
Tuesday, May 19, 2009
Housing Starts Disaster (Graph)
Housing Starts, Chart
The chart shows the severity of the drop to 458,000 starts. The all time record low for this series dating back to 1959. The chart also compares this cycle to the previous four recession. Not a good picture.
On the hand, it is a disaster. On the other hand, is the glass half full?
The core level of custom houses being built is in the range of 200,000 -- 250,000. These houses are pre-ordered and built to buyer specifications. So, the number of houses being started by building companies is dwindling down toward the 200,000 area.
In the short run, this is bad for the economy. On the other hand, the overhanging supply of houses might get drawn down sooner than expected.
Kindle: Amazon's Wireless Reading Device (Latest Generation)
The chart shows the severity of the drop to 458,000 starts. The all time record low for this series dating back to 1959. The chart also compares this cycle to the previous four recession. Not a good picture.
On the hand, it is a disaster. On the other hand, is the glass half full?
The core level of custom houses being built is in the range of 200,000 -- 250,000. These houses are pre-ordered and built to buyer specifications. So, the number of houses being started by building companies is dwindling down toward the 200,000 area.
In the short run, this is bad for the economy. On the other hand, the overhanging supply of houses might get drawn down sooner than expected.
Subscribe to All American Investor via Email
| Bob DeMarco is a citizen journalist and twenty year Wall Street veteran. Bob has written more than 500 articles with more than 11,000 links to his work on the Internet. Content from All American Investor has been syndicated on Reuters, the Wall Street Journal, Fox News, Pluck, Blog Critics, and a growing list of newspaper websites. Bob is actively seeking syndication and writing assignments. |
Housing Starts Plunge Year over Year
HOUSING STARTS
The April rate for units in buildings with five units or more was 78,000.
This is the lowest number on record. And, obviously a new low for the down move in housing starts.
Source Census Bureau
- Privately-owned housing starts in April were at a seasonally adjusted annual rate of 458,000.
- This is 12.8 percent below the revised March estimate of 525,000 and is 54.2 percent below the revised April 2008 rate of 1,001,000.
The April rate for units in buildings with five units or more was 78,000.
This is the lowest number on record. And, obviously a new low for the down move in housing starts.
Source Census Bureau
Subscribe to All American Investor via Email
| Bob DeMarco is a citizen journalist and twenty year Wall Street veteran. Bob has written more than 500 articles with more than 11,000 links to his work on the Internet. Content from All American Investor has been syndicated on Reuters, the Wall Street Journal, Fox News, Pluck, Blog Critics, and a growing list of newspaper websites. Bob is actively seeking syndication and writing assignments. |
Thursday, April 30, 2009
Home Vacancies at a Record -- The Opportunity of a Lifetime
The time to buy the biggest house you can get your hands on is right now. Even if you own a house and it is underwater -- you should bite the bullet and sell it. Get a bigger home.
Sound nutty? I lived in Texas in the 1980s. I watched people scarp up houses in Houston for $400,000 -- houses that the previous owners paid $1.25 million to own.
But today the opportunity is even better. In the late 80s mortgage interest rates were around 10 percent. Now? 4.5 percent.
Imagine 20 years from now, living in your nice big beautiful house, and you locked in your monthly payment way down here. On an inflation adjusted basis you will paying peanuts.
The time to borrow money is when interest rates are low. Most of you are probably too young to remember when mortgage interest rates were 15 percent. You probably are thinking it will never happen again.
What were you thinking and doing when the Internet stock bubble burst? What were you doing in 2006? Thinking about how you had to get a nice big fat, overpriced house?
Can't quite afford the down payment? Beg, borrow, steal -- do it.
More from All American Investor
Follow All American Investor on Twitter
Sound nutty? I lived in Texas in the 1980s. I watched people scarp up houses in Houston for $400,000 -- houses that the previous owners paid $1.25 million to own.
But today the opportunity is even better. In the late 80s mortgage interest rates were around 10 percent. Now? 4.5 percent.
Imagine 20 years from now, living in your nice big beautiful house, and you locked in your monthly payment way down here. On an inflation adjusted basis you will paying peanuts.
The time to borrow money is when interest rates are low. Most of you are probably too young to remember when mortgage interest rates were 15 percent. You probably are thinking it will never happen again.
What were you thinking and doing when the Internet stock bubble burst? What were you doing in 2006? Thinking about how you had to get a nice big fat, overpriced house?
Can't quite afford the down payment? Beg, borrow, steal -- do it.
A record 19.1 million homes stood unoccupied in the first quarter and the U.S. homeownership rate fell as the recession sapped demand for real estate.
The number of vacant homes, including foreclosures, properties for sale and vacation properties, jumped from 18.6 million a year earlier, the U.S. Census Bureau said in a report today. Households that own their own residence declined for the third straight quarter to 67.3 percent.
Subscribe to All American Investor via Email
| Bob DeMarco is a citizen journalist and twenty year Wall Street veteran. Bob has written more than 500 articles with more than 11,000 links to his work on the Internet. Content from All American Investor has been syndicated on Reuters, the Wall Street Journal, Fox News, Pluck, Blog Critics, and a growing list of newspaper websites. Bob is actively seeking syndication and writing assignments. |
More from All American Investor
- 30 Year Conventional Mortgage Rate (Chart)
- Top Hedge Fund Managers Make Billions in 2008
- Systemic Risk Defined--Too Big to Fail
- Ray Dalio on the current state of affairs in the market
- Roubini Predicts U.S. Losses May Reach $3.6 Trillion
- Option ARM--The Toxic Mortgage
- Warren Buffett's Annual Letter to Investors (Cliff Notes Version)
Follow All American Investor on Twitter
Tuesday, April 07, 2009
Whitney: Banks Improve, Housing down another 30 Percent
Banking analyst Meredith Whitney talks about the outlook for financials.
Cliff notes:
- First five minutes of the tape on Banks
- Gets to the drop in housing prices at the five minute, thirty second mark.
- "I think you’ll see a directional turn," Whitney said in a live interview. "Banks will make a little money, as little as a penny a share, but they won’t lose money."
- Said she expected home prices to fall another 30 percent, contrary to some predictions that housing may have bottomed.(link refers to Diana Olick--yikes)
Banks' 1st-Quarter Results May Show Improvement: Whitney
Subscribe to All American Investor via Email
Thursday, March 26, 2009
Nonfinancial Corporate Business: Profits After Tax (Chart)

There is a long lag in this chart, so its safe to assume after tax profits are still dropping.
I put this chart up for two reasons. First, if you look closely and think about it, you will see that after tax profits are falling back to the trend. Second, this chart shows how really wild and crazy things were in the period from 2004-2006.
You could infer further that a lot of business got done because of artificially low interest rates and readily available cheap credit. For example, several years worth of houses and cars were built and sold in a short period of time. This explains the oversupply right now. Much of what is going on is simple supply and demand. To much supply lead to a lack of current demand. In other words, the demand had already been supplied--and for years in advance.
If you look and think beyond the obvious, that is what this website is all about, you could conclude it is going to take a while to work off these excesses. It takes time. And, that is exactly what is happening--time.
Corporate after tax profits bear watching. The market will discount the bottom long before it they hit their lows and flatten. Once the bottom is in all comparative economic releases will begin to look good because we will be comparing the then current releases to the very low numbers of the past.
Subscribe to All American Investor via Email
| Bob DeMarco is a citizen journalist and twenty year Wall Street veteran. Bob has written more than 500 articles with more than 11,000 links to his work on the Internet. Content from All American Investor has been syndicated on Reuters, the Wall Street Journal, Fox News, Pluck, Blog Critics, and a growing list of newspaper websites. Bob is actively seeking syndication and writing assignments. |
Follow All American Investor on Twitter
More from All American Investor
- Systemic Risk Defined--Too Big to Fail
- Ray Dalio on the current state of affairs in the market
- Roubini Predicts U.S. Losses May Reach $3.6 Trillion
- Six Errors on the Path to the Financial Crisis
- Who Caused the Financial Crisis?
- Option ARM--The Toxic Mortgage
- Debt Binge--The Perfect Financial Storm
- Warren Buffett's Annual Letter to Investors (Cliff Notes Version)
Wednesday, March 18, 2009
Southern California Home Prices Stabilize
For the first time in 10 months, the median home price in Southern California in February didn’t decline from the prior month, the La Jolla, Calif., firm said. The median price for a home sold in the counties of Los Angeles, Riverside, San Diego, Ventura, San Bernardino and Orange last month was $250,000. While that was down 39% from February 2008, it was unchanged from January.
Foreclosures continue to dominate the market. Sales of bank-owned properties accounted for 56% of total home resales in February, MDA DataQuick said.
Source: MDA DataQuick
Subscribe to All American Investor via Email
Tuesday, March 17, 2009
The Real Picture on Housing Starts--Chart
They say a picture is worth a thousand words. You can decide for yourself.
HOUSING STARTS

Source: ST. Louis Federal Reserve, Census Bureau
HOUSING STARTS
Privately-owned housing starts in February were at a seasonally adjusted annual rate of 583,000. This is 22.2 percent (±13.8%) above the revised January estimate of 477,000, but is 47.3 percent (±5.3%) below the revised February 2008 rate of 1,107,000.
Single-family housing starts in February were at a rate of 357,000; this is 1.1 percent (±11.0%)* above the January figure of 353,000.
The February rate for units in buildings with five units or more was 212,000.
Source: ST. Louis Federal Reserve, Census Bureau
Subscribe to All American Investor via Email
Subscribe to:
Posts (Atom)